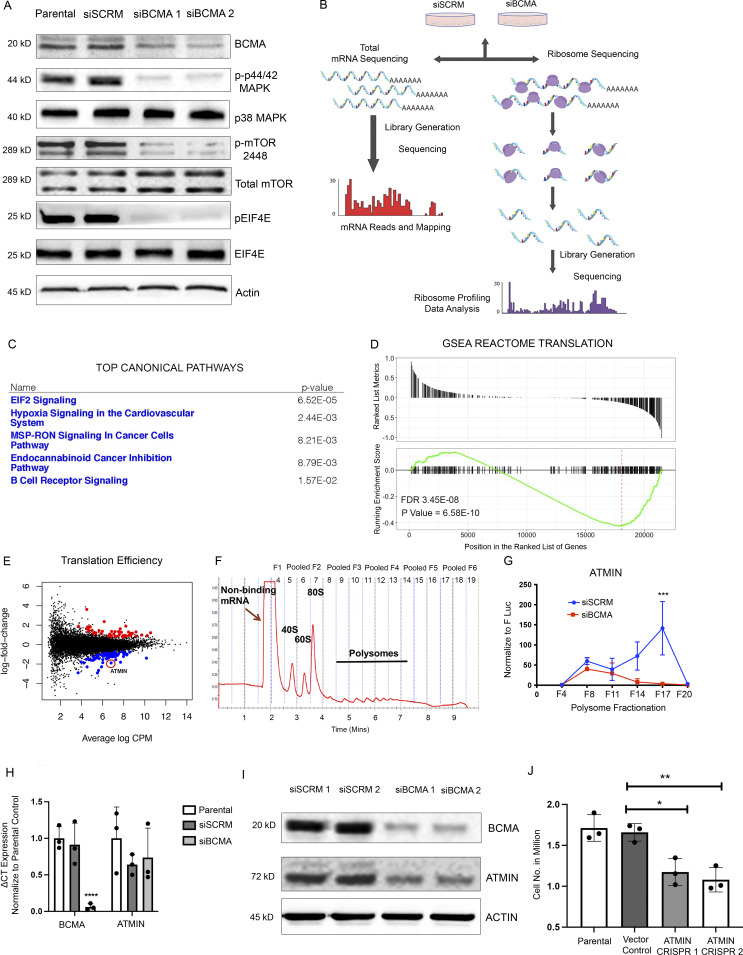
Figure 2.
Ribosome profiling identifies BCMA as a master regulator of protein translation machinery in MM. (A) Western blotting analysis of changes in protein expression associated with protein translation upon genetic knockdown using siBCMA. (B) Schematic illustration of ribosome profiling workflow. (C) Ingenuity pathway analysis of RNA-seq data showing top five significantly changed canonical pathways. (D) GSEA REACTOME enrichment analysis showing enriched signatures in associated with protein translation. FDR, false discovery rate. (E) Translation efficiency analysis of MM cells upon loss of BCMA expression in MM. Significant events are colored in blue (downregulated) and red (upregulated). ATMIN highlighted with red circle. (F) Representative polysome profile of MM cells fractionated by ultracentrifugation through a 10–50% sucrose gradient. Fractions were pooled for mRNA analysis. (G) Relative abundance of ATMIN mRNA expression analyzed in each of the pooled polysome fractions comparing siSCRM with siBCMA MM cells. Each biological sample were performed in triplicate. P = 0.0228. (H) Total mRNA expression of BCMA (P = 0.0078) and ATMIN (NS) examined in parental, siSCRM, and siBCMA U266 cells. Each biological sample was performed in triplicate. (I) Western blotting analysis of ATMIN expression in siSCRM and two clones of siBCMA MM cells. (J) Cell growth analysis comparing ATMIN vector control with ATMIN CRISPR KO clone #1 (P = 0.0129) and with ATMIN CRISPR KO clone #2 (P = 0.0055) in U266 MM cells. Statistical analysis was conducted using t test and one-way ANOVA for comparing between treatment groups. *, P < 0.05; **, P < 0.01; ***, P < 0.001. Source data are available for this figure: SourceData F2.

