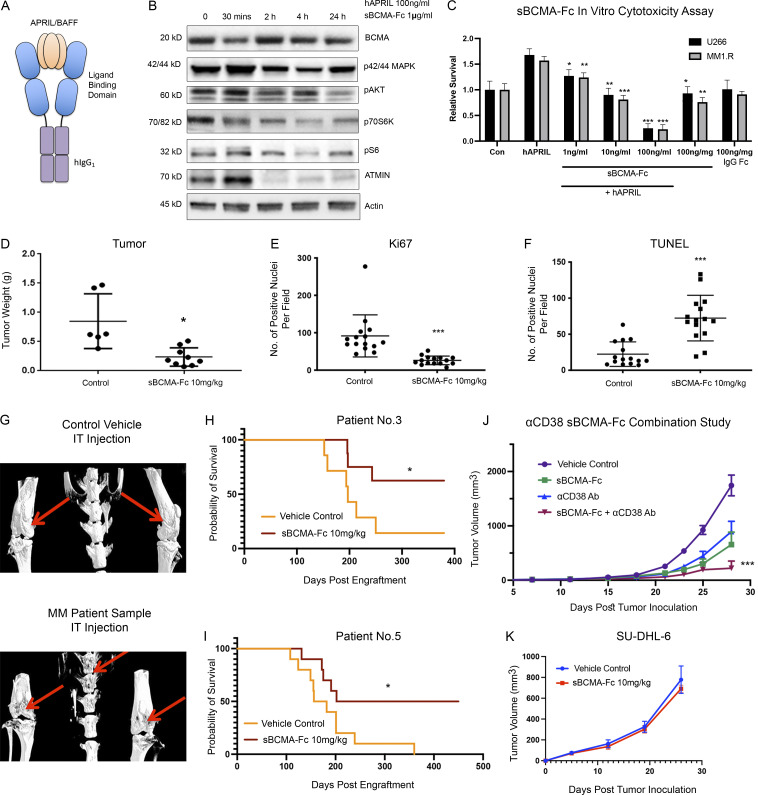
Figure 3.
Wild-type sBCMA decoy receptor inhibits MM growth through APRIL/BCMA signaling but lacks efficacy in BAFF-driven DLBCL model. (A) Schematic illustrations of recombinant human sBCMA-Fc binding to human APRIL. (B) Analysis of BCMA downstream protein expression in U266 MM cells upon sBCMA-Fc treatment at multiple time points. (C) sBCMA-Fc dose-dependent cytotoxicity assay validating in vitro cell survival in the presence of increasing doses of sBCMA-Fc (P = 0.0095, 1 ng/ml; P = 0.0024, 10 ng/ml; and P = 0.0001, 100 ng/ml) and hAPRIL (100 ng/ml) in U266 and MM1.R MM cells. Cells were maintained in low (3%) FCS to reduce possible growth stimulation mediated through other growth factors present in FCS. Each sample was performed in triplicate. (D) Terminal tumor weight of mice inoculated with MM1.R MM tumors and treated with vehicle control or 10 mg/kg of sBCMA-Fc; P = 0.0217. (E) Quantification of Ki67 staining in MM1.R MM tumors and treated with vehicle control or 10 mg/kg of sBCMA-Fc; P = 0.0001. (F) Quantification of TUNEL staining in MM1.R MM tumors and treated with vehicle control or 10 mg/kg of sBCMA-Fc; P = 0.0001. (G) Representative CT scans of mice tibias, femurs, and vertebrae inoculated with control (top) or MM PDX tumor cells (bottom). Osteolytic bone degradation was observed in MM PDX injected animal (bottom image) but not in the control injected animals (top image). (H) Kaplan–Meier survival analysis of animals engrafted with MM cells from patient 3 showing prolonged overall survival in the sBCMA-Fc–treated group (n = 8) compared with the vehicle control (n = 7); P = 0.027. (I) Kaplan–Meier survival analysis of animals engrafted with MM cells from patient 5 showing prolonged overall survival in the sBCMA-Fc–treated group (n = 10) compared with vehicle control (n = 10); P = 0.0362. (J) Subcutaneous tumor growth of MM1.R MM tumors in 6-wk-old female NSG mice dosed with sBCMA-Fc 10 mg/kg every 48 h (n = 7); P = 0.0195. αCD38 10 mg/kg weekly (n = 7; P = 0.0238) and sBCMA-Fc and αCD38 combination (n = 8; P < 0.001) compared with vehicle control (n = 8). (K) Subcutaneous tumor growth of SU-DHL-6 DLBCL tumors in mice dosed with vehicle control or sBCMA-Fc 10 mg/kg every 48 h (n = 5). Statistical analysis was conducted using t test and one-way ANOVA for comparing between treatment groups. Repeated ANOVA used for changes in tumor growth over time. *, P < 0.05; **, P < 0.01; ***, P < 0.001. Source data are available for this figure: SourceData F3.

