Figure S5.
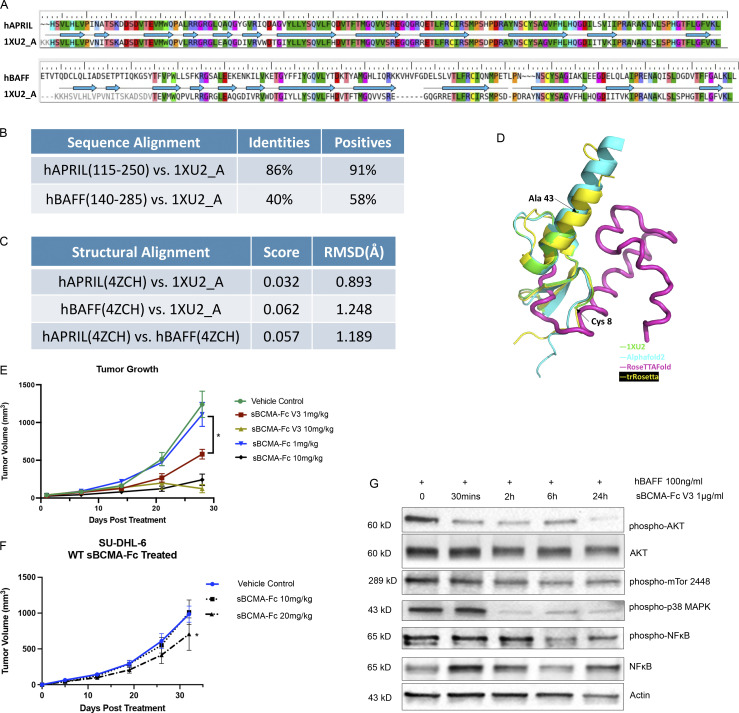
Affinity-enhanced sBCMA-Fc V3 treatment inhibits tumor growth in models of MM and DLBCL. (A) Amino acid sequence alignment between hAPRIL (top) or hBAFF (bottom) and Protein Data Bank structural ID 1XU2 (structure of mAPRIL and human sBCMA cocomplex). PDB 4ZCH reported a single-chain human APRIL-BAFF-BAFF heterotrimer structure. (B) Quantification of sequence alignment between hAPRIL/hBAFF and published structure 1XU2. (C) Quantification of structural alignment between hAPRIL/hBAFF and published structure 1XU2 as well as between predicted hAPRIL and hBAFF structures. (D) Structure overlay of extracellular BCMA flexible region (aa 44–54) between 1XU2 and structures predicted using Alphafold2 (cyan), RoseTTAfold (magenta), and trRosetta (yellow). (E) Subcutaneous tumor growth of MM1.R MM tumors in 6-wk-old female NSG mice dosed with wild-type sBCMA-Fc at 1 and 10 mg/kg every 48 h (n = 5), sBCMA-Fc V3 at 1 and 10 mg/kg every 48 h (n = 5), and vehicle control (n = 5). sBCMA-Fc V3 treatment significantly reduced tumor growth at 1 mg/kg; P = 0.031. (F) Subcutaneous tumor growth of SU-DHL-6 DLBCL in mice dosed with vehicle control, sBCMA-Fc 10 mg/kg, and sBCMA-Fc 20 mg/kg every 48 h (n = 5). sBCMA-Fc treatment significantly reduced tumor growth at 20 mg/kg; P = 0.043. (G) Analysis of BCMA downstream protein expression in SU-DHL-6 DLBCL cells upon sBCMA-Fc V3 treatment at multiple time points. Statistical analysis was conducted using t test and one-way ANOVA for comparing between treatment groups. Repeated ANOVA used for changes in tumor growth over time. *, P < 0.05; **, P < 0.01; ***, P < 0.001. Source data are available for this figure: SourceData FS5.

