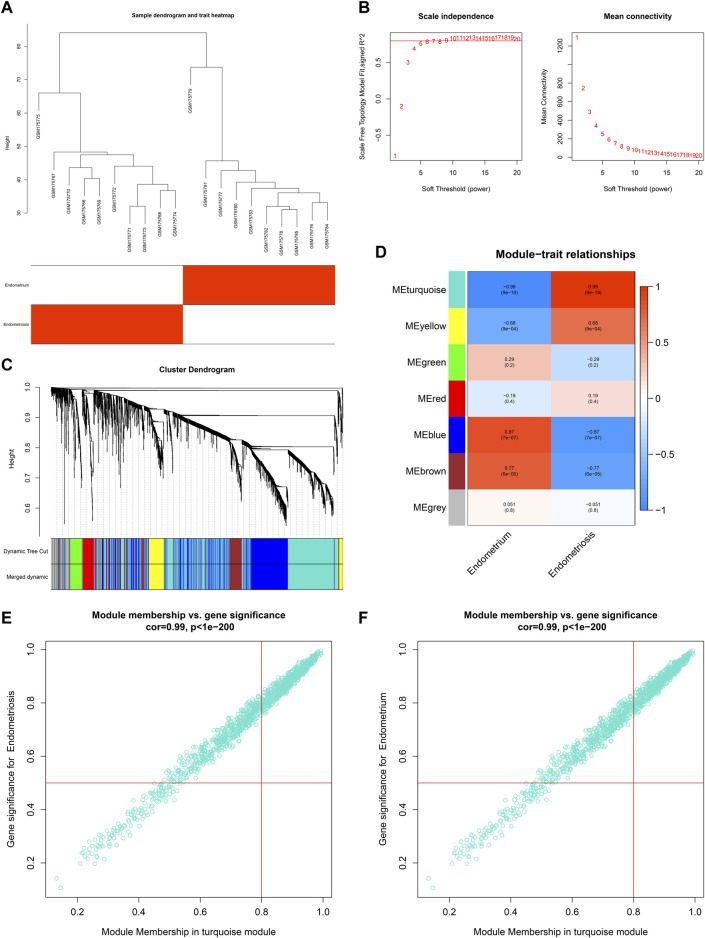
FIGURE 1.
Co-expression analysis in the GSE7305 dataset. (A) Clustering dendrograms of specimens. (B) Determining the weighted value β that satisfied a scale-free network. (C) Co-expression module clustering. Each branch represented each gene, and genes clustered into the same module were assigned the same color. (D) Correlations of modules with normal endometrium and endometriosis conditions. (E,F) Scatter plots for the relationships of module membership in the turquoise module with gene significance for (E) endometriosis or (F) normal endometrium.

