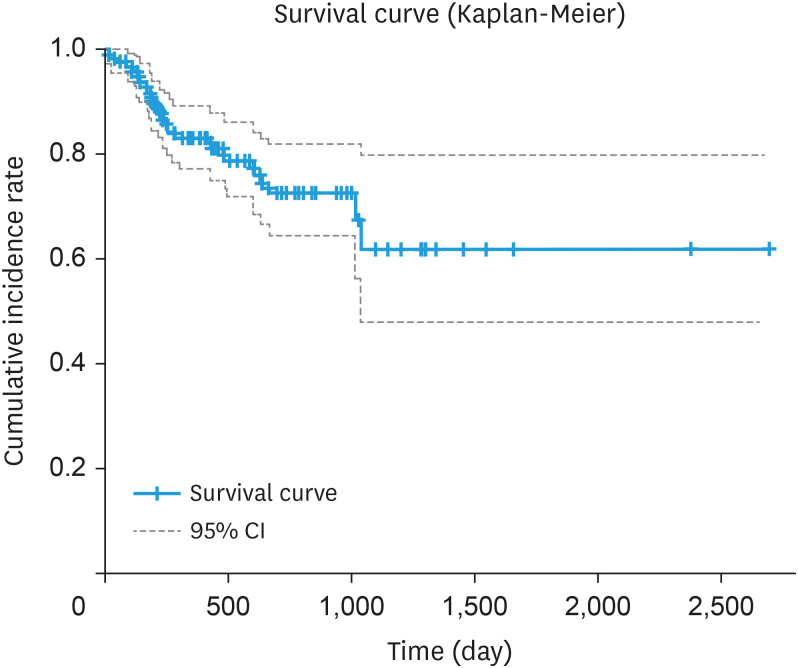
Fig. 3. Progression time from CIN2 to CIN3 based on findings by senior colposcopists. The Kaplan-Meier curve shows the survival time from baseline (time of CIN2 diagnosis) to the time of CIN3 diagnosis. Baseline: time point of diagnosis of CIN2; Event: first time point to CIN3 diagnosis; Survival time: time from baseline to event (n=126).
CI, confidence interval; CIN, cervical intraepithelial neoplasia.

