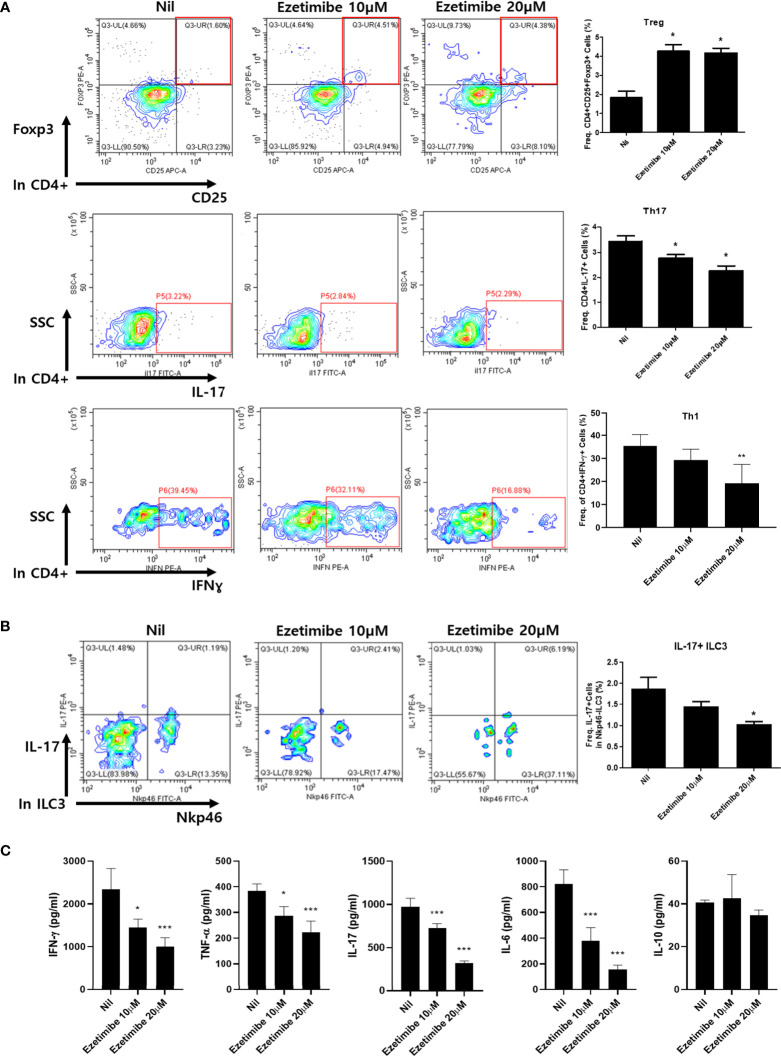
Figure 3.
Effects of ezetimibe on mouse splenocytes in vitro. (A) The populations of Treg, Th17 and Th1 cells were analyzed by flow cytometry. (B) IL-17-producing ILC3 population. (C) The concentrations of IFN-γ, TNF-α, IL-17, IL-6 and IL-10 were measured by ELISA in culture supernatants. Values are means ± SEMs of three independent experiments. *p < 0.05, **p < 0.01, ***p < 0.001.

