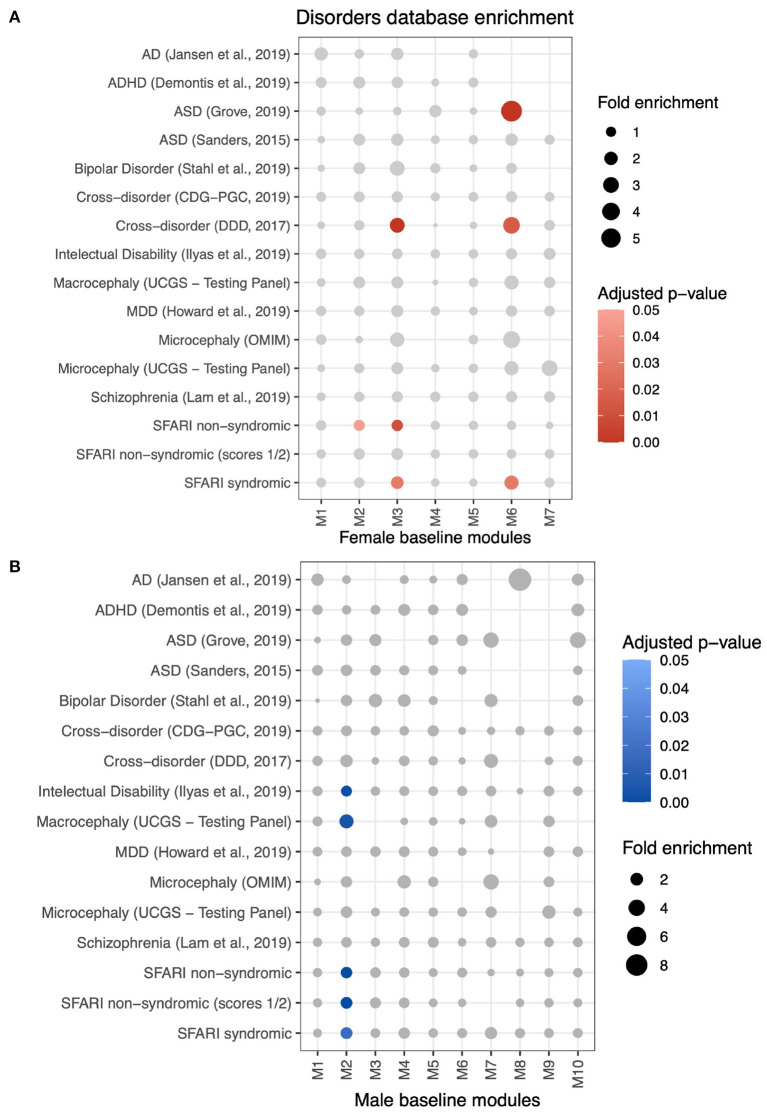
Figure 6.
Enrichment analysis using MSET to identify differential modules with genes associated with neuropsychiatric disorders lists from multiple databases (see Methods). (A) Disorders to which female-baseline differential modules are significantly enriched are represented by red scaled circles (adjusted p < 0.05). Circle size is relative to the fold enrichment. (B) Enrichment of male-baseline differential modules to disorders databases.

