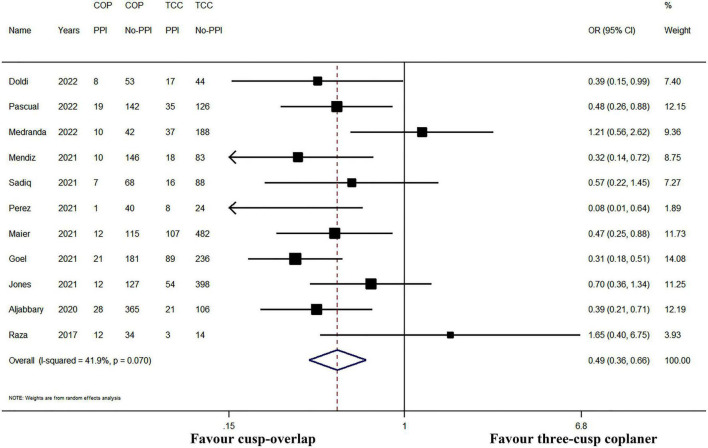
FIGURE 3.
Meta-analysis of the primary outcome of interest. CI, confidence interval; COP, cusp-overlap projection; OR, odds ratio; PPI, permanent pacemaker implantation; TCC, three-cusp coplanar. Forrest plot has shown the comparison of post-operative PPI. Since significant heterogeneity existed (heterogeneity Chi-square p = 0.070), a random-effects model was used. The bars represented a 95% CI.

