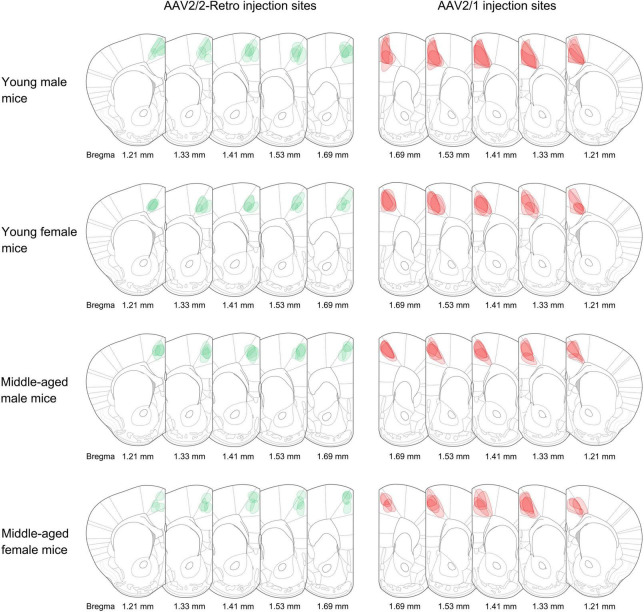
FIGURE 1.
Adeno-associated virus (AAV) injection sites. The schematic depicts the actual injection site of the virus into the rACC. The boundaries of the green and red colors represent the range of retrograde non-transsynaptic (AAV2/2-Retro-hSyn-EGFP) and anterograde monosynaptic (AAV2/1-hSyn-CRE-mCherry) AAV. The corresponding bregma value of brain slices is marked below. The image represents n = 4 animals.

