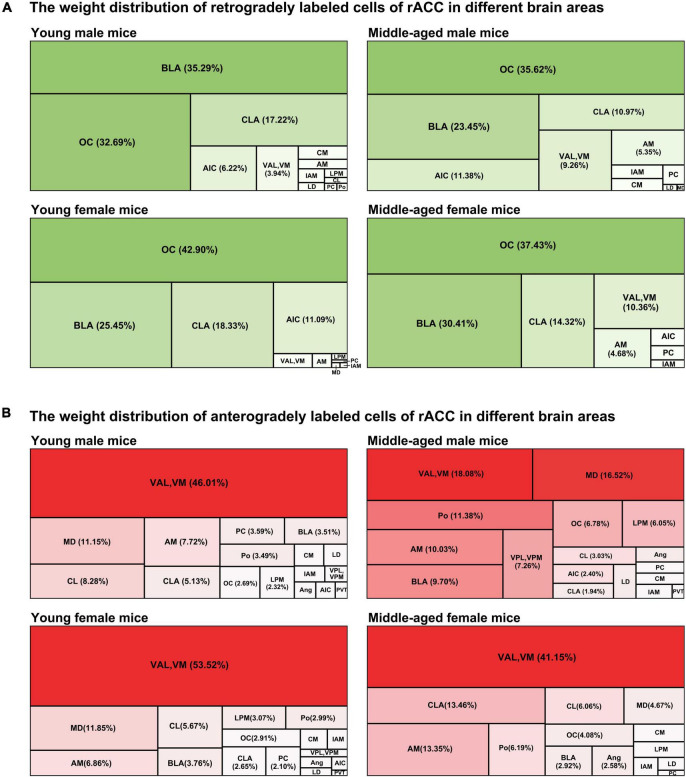
FIGURE 4.
The weight distribution of retrogradely and anterogradely labeled cells of the rACC in different brain regions. (A) The four tree maps indicate the weight distribution of retrogradely labeled cells of the rACC in different brain areas. (B) The four tree maps indicate the weight distribution of anterogradely labeled cells of the rACC in different brain areas.

