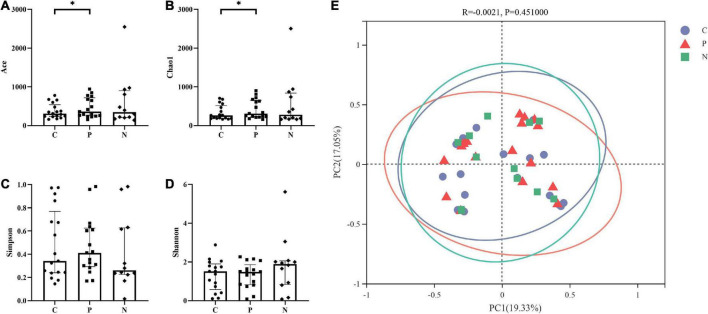
FIGURE 2.
Alpha and beta diversity among Groups C, P, and N. The Ace and Chao1 indices in Group C were higher than those in Group P (P < 0.05), but there were no differences between Groups C and N or between Groups P and N (P > 0.05). (A,B) The Simpson and Shannon indices showed no difference among Groups C, P and N (P > 0.05). (C,D) There was no significant difference in the beta diversity among the three groups (P > 0.05) (E).

