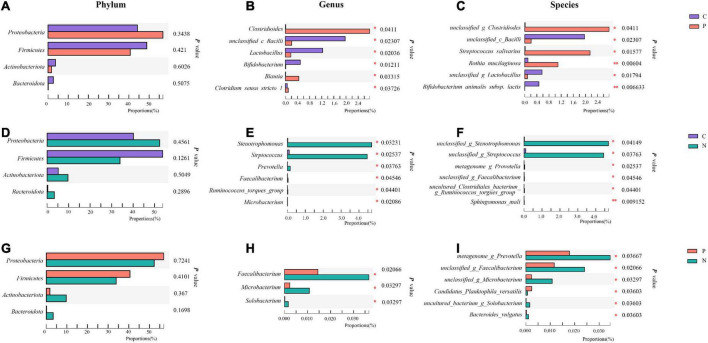
FIGURE 3.
Community abundance of the gut microbiota in Groups C, P, and N. Differences between Groups C and P at the phylum (A), genus (B) and species (C) levels. Differences between Groups C and N at the phylum (D), genus (E) and species (F) levels. Differences between Groups P and N at the phylum (G), genus (H) and species (I) levels. *P < 0.05, **P < 0.01.

