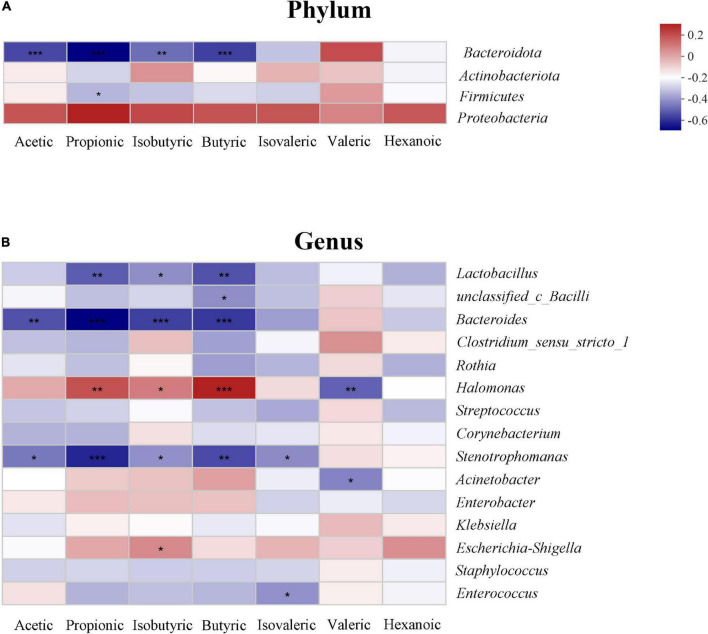
FIGURE 6.
Relationship between the gut microbiota and short-chain fatty acids (SCFAs) on phylum (A) and genus level (B) in the study. The change in color reflects the data in the two-dimensional matrix. The color depth indicates the size of the value, and it can intuitively express the size of the value in a defined color depth.

