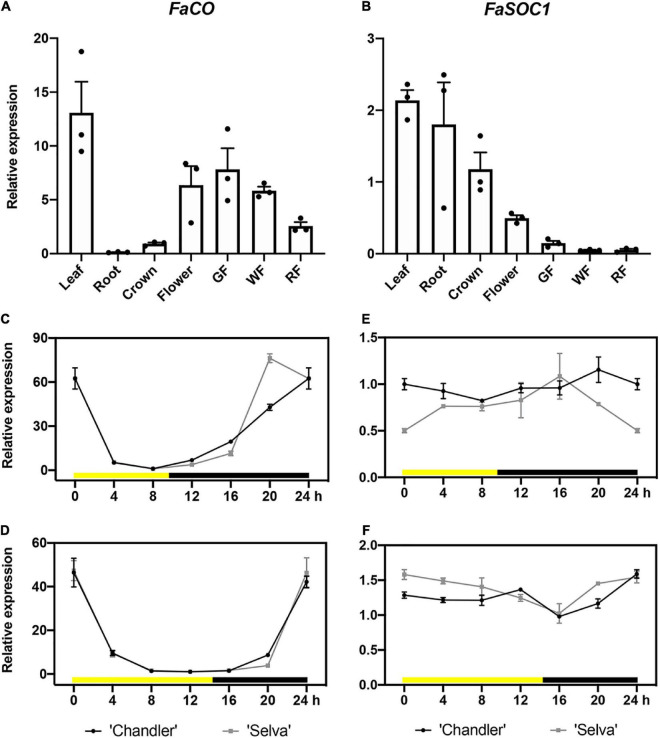
FIGURE 2.
Spatial and diurnal expression of FaCO and FaSOC1 by RT-qPCR. Relative expression levels of FaCO (A) and FaSOC1 (B) in different tissues or organs. mRNA diurnal rhythms of FaCO under SD (C) and LD (D). mRNA diurnal rhythms of FaSOC1 under SD (E) and LD (F). The first sample was taken at dawn: 0 h Zeitgeber time (ZT). Relative gene expression levels were normalized to the expression of FaGAPDH and crown tissue (A,B), 8 h (C,D), or 16 h (E,F) were used as reference samples. Data are means ± SEM of three biological replicates.

