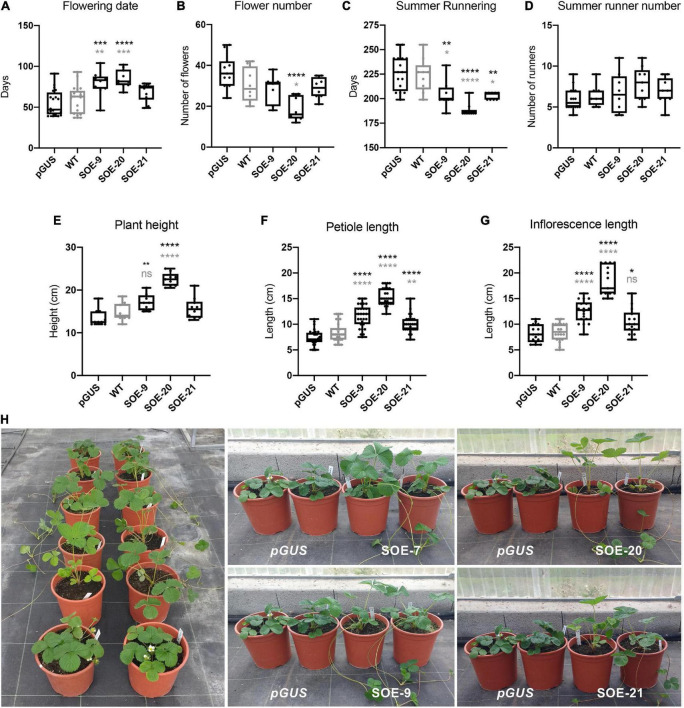
FIGURE 4.
Phenotype of 35S:FaSOC1 lines (SOE) in comparison to control plants. (A) Number of days to flowering from November 20th. (B) Total flower number (from November 20th until September 1st). (C) Number of days until the first summer stolon. (D) Number of stolons until September 20th. (E) Plant height. (F) Length of leaf petioles. (G) Length of inflorescence peduncle. Boxes span the 25th and 75th percentiles and the middle line represents the median. Whiskers (T-bars) are the minimum and maximum values. Asterisks represent significant differences between pGUS (in black) or ‘Camarosa’ wild type (WT; in gray) and 35S:FaSOC1 over-expresser plants; Statistical significance was determined by ANOVA and Tukey’s test (*P < 0.05, **P < 0.01, ***P < 0.001, ****P < 0.0001). (H) Phenotype of 35S:FaSOC1 lines in comparison to control GUS plants. Two representative replicates are shown. Pictures were taken in November.

