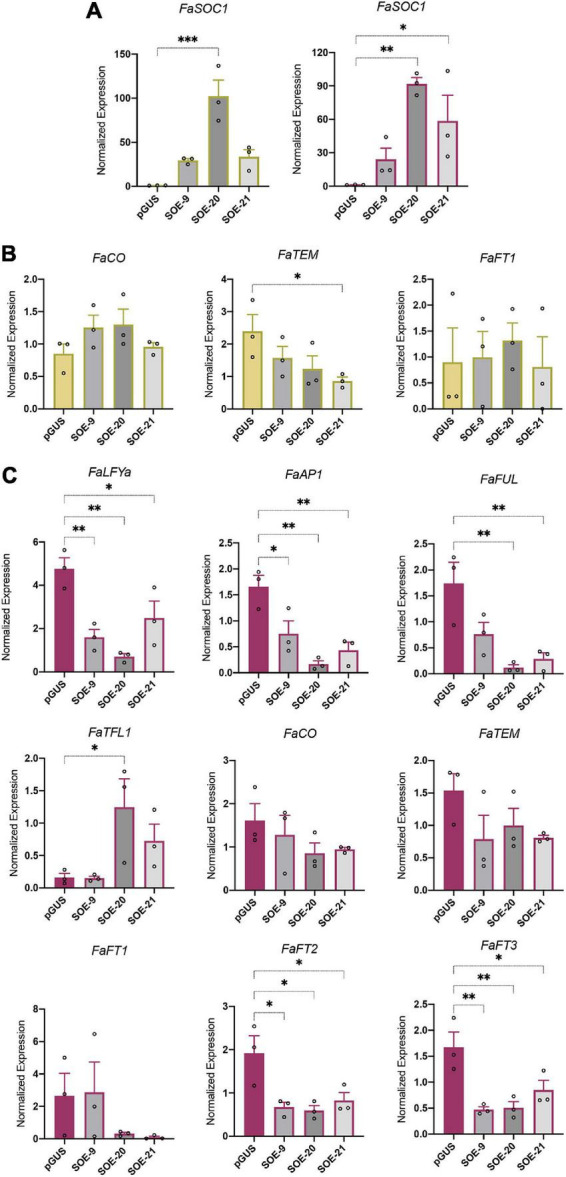
FIGURE 5.

Gene expression analysis in 35S:FaSOC1 lines (SOE). (A) FaSOC1 overexpression in leaves (green, left panel) and crown (purple, right panel) of three independent SOE lines. (B) FaCO, FaTEM and FaFT1 expression in leaves of SOE lines. (C) Flowering time gene expression in crowns from SOE lines. All samples were collected under natural SD (9 h52 min/14 h17 min day/night; average maximum and minimum temperature from previous 4 weeks: 21.1/10.6°C) conditions at ZT3. Graphs show the average of normalized values from three biological replicates ± SEM. In each bar, dots represent the normalized value of each biological replicate. *p < 0.05, **p < 0.01, ***p < 0.001.
