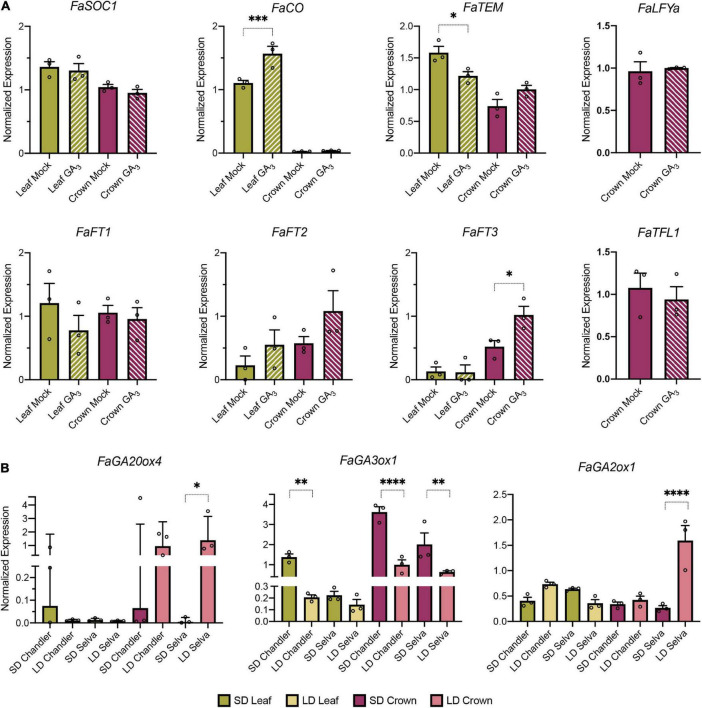
FIGURE 7.
Role of GA in the shift between floral and vegetative development in F. × ananassa. (A) Flowering time gene expression in response to exogenous GA3 treatment in leaves (green) and crowns (purple) from SF ‘Camarosa’ plants. (B) GA metabolism gene expression in leaves and crowns from the SF cultivar Chandler and the PF cultivar Selva collected under SD and LD. Graphs show the average of normalized values from three biological replicates ± SEM. In each bar, dots represent the normalized value of each biological replicate. *p < 0.05, **p < 0.01, ***p < 0.001, ****p < 0.0001.

