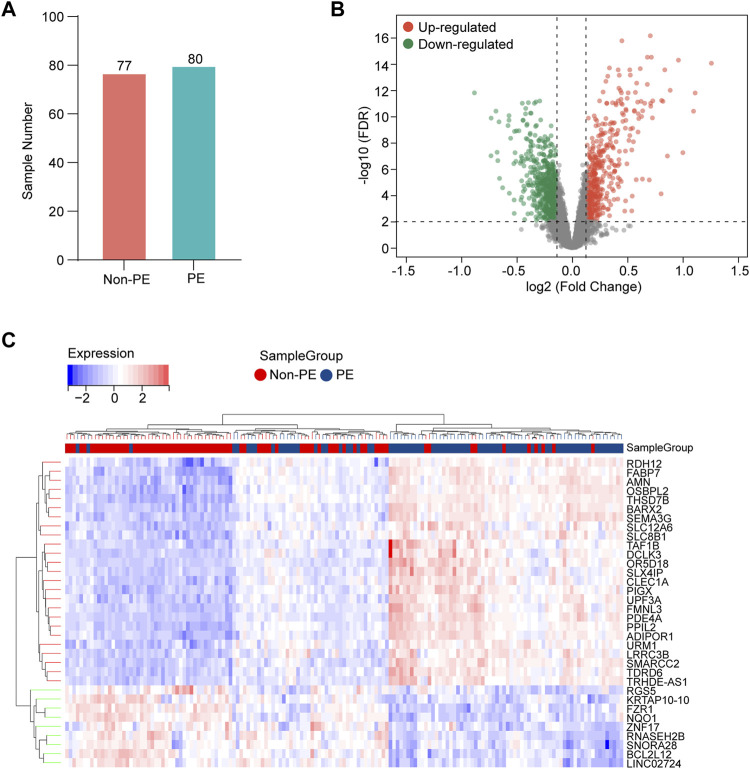
FIGURE 2.
Identification of DEGs in the placenta samples. (A) Information of sample sizes. (B) Volcano plot. Red dots represent upregulated genes, gray dots represent non-significant genes, and green dots represent downregulated genes. (C) Heatmap for hierarchical clustering of DEGs in non-PE group and PE group.

