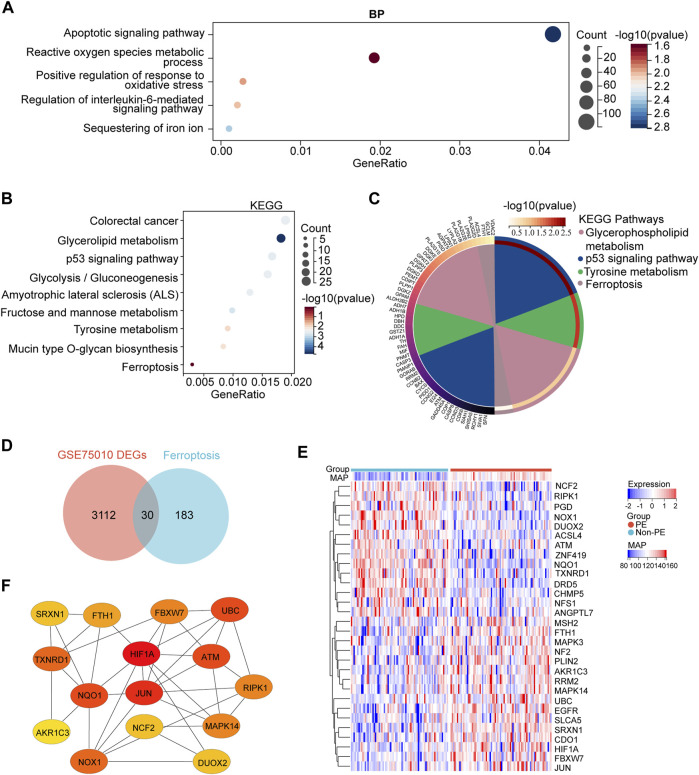
FIGURE 3.
GO and KEGG enrichment analyses of DEGs and the identification of the ferroptosis-related DEGs genes. (A) Bubble plots of the biological process of GO analysis (B) Bubble plot of the KEGG pathway enrichment of DEGs. (C) Circle plot and network visualizing the KEGG pathway (D) Venn diagram of ferroptosis differentially expressed genes. Identification of ferroptosis-related DEGs by the intersection of ferroptosis dataset with GSE75010. (E) Heatmap depicts the expression levels of ferroptosis-related DEGs among the patients with different MAP. (F) Top 15 hub ferroptosis-related DEGs distinguished using color shading from yellow to red, according to the score.

