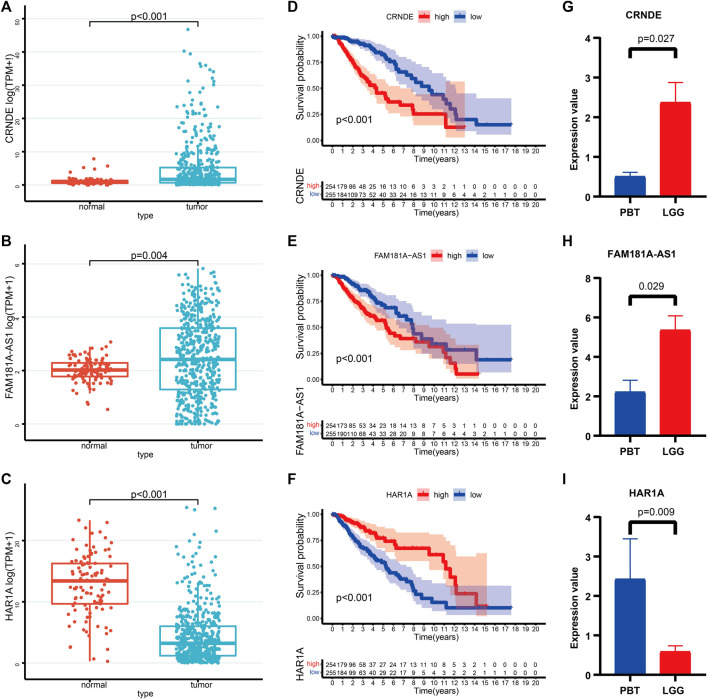
FIGURE 10.
(A–C) The expression levels of CRNDE (A), FAM181A-AS1 (B), and HAR1A (C) between normal brain tissues and LGG. (D–F) K-M survival curves of the high- and low levels of CRNDE (D), FAM181A-AS1 (E), and HAR1A (F) in LGG patients. (G–I) Relative expression of CRNDE (G), FAM181A-AS1 (H), and HAR1A (I) was detected by qRT-PCR in four pairs of LGG and PBT.

