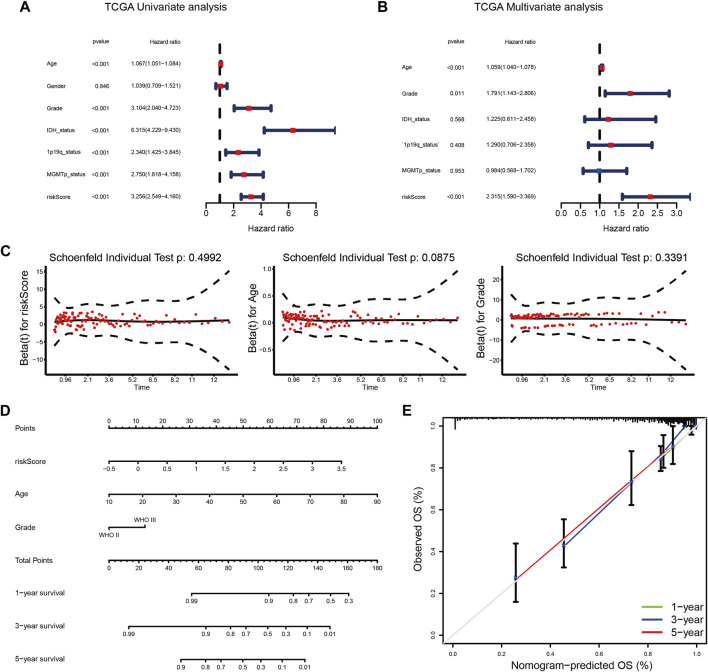
FIGURE 6.
(A,B) Univariate (A) and multivariate (B) Cox analyses of the prognostic signature in the TCGA cohort. (C) PH hypothesis test for each independent prognostic factor. (D) A nomogram for predicting the 1-, 3-, and 5-years survival rates of LGG patients in the TCGA cohort. (E) The calibration curves predicted 1-, 3-, and 5-years survival rates in the TCGA cohort.

