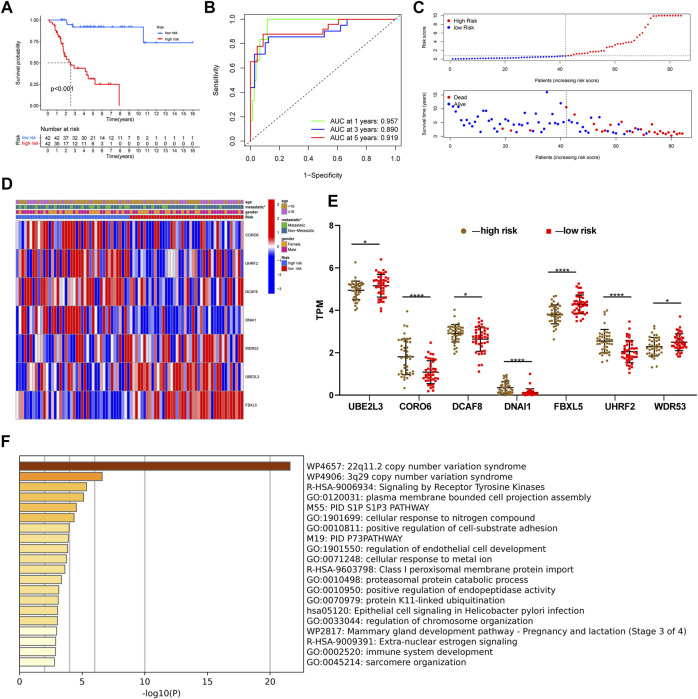
FIGURE 3.
Evaluating a ubiquitin-related gene signature. (A) The Kaplan–Meier survival curve in the Target set. (B) The ROC curves in the Target set. (C) Risk score distribution and survival status of OS patients in the Target set. (D) Heatmap of seven ubiquitin-related genes with combining clinical information in the Target set. (E) Differential expression of these seven genes between high and low-risk groups. (F) Functional annotation of co-expression genes through the metascape. *p < 0.05, **p < 0.01, ***p < 0.001, ****p < 0.0001.

