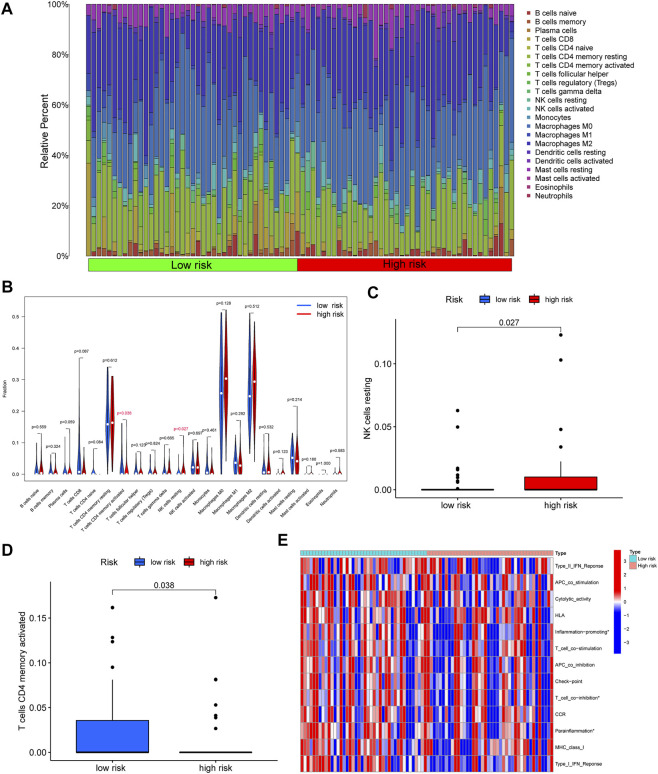
FIGURE 6.
Correlation between immune and risk score model. (A) The 22 immune cells landscape between high- and low-risk groups. (B) Comparison with the percentage of immune cells in the high- and low-risk groups. (C–D) A significant percentage of T cells CD4 memory activated and NK cells resting. (E) The significant immune-related functions in the different risk score groups (∗ p < 0.05).

