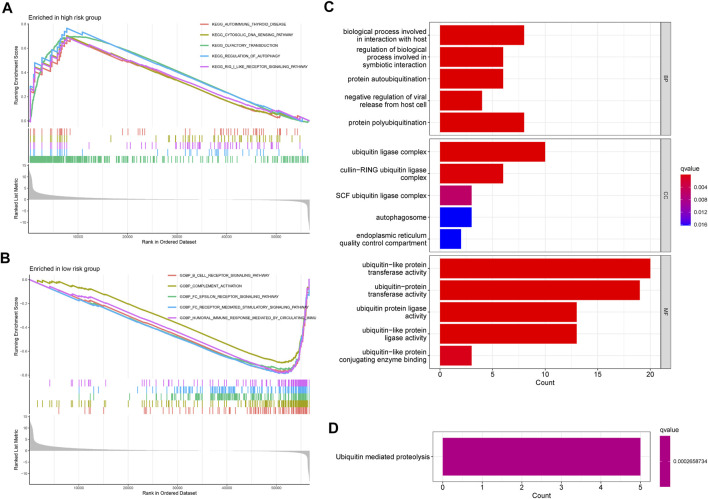
FIGURE 7.
GSEA, GO, and KEGG. (A) The GSEA showed significant enrichment in the low-risk groups. (B) The GSEA showed significant enrichment in the low-risk groups. (C) The significant GO terms are based on the prognosis-related ubiquitin-related genes. (D) The significant KEGG pathways are based on the prognosis-related ubiquitin-related genes.

