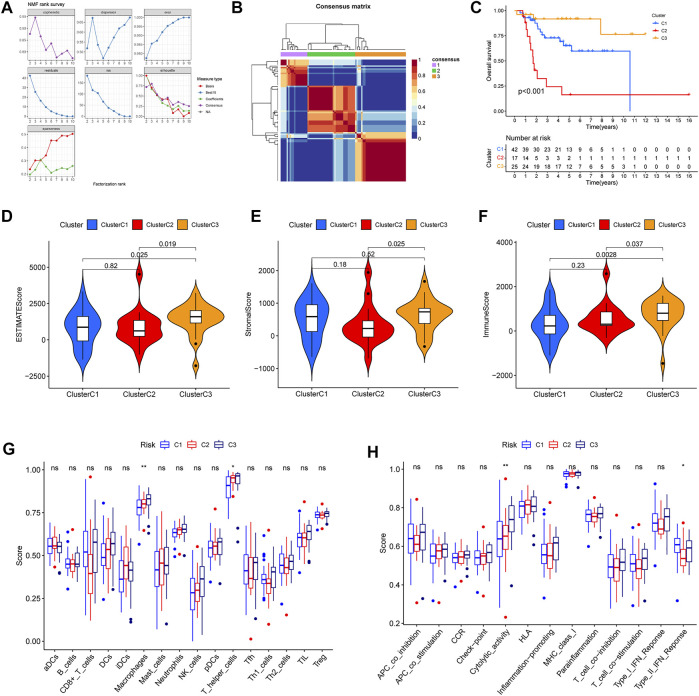
FIGURE 9.
Different immune microenvironment and immune-related functions in the osteosarcoma subtypes. (A) The value of the nonnegative matrix factorization (NMF). (B) The NMF clustering-based value of best cophenetic. (C) Kaplan–Meier curves of OS in the three clusters. (D–F) The ESTIMATE score, stromal score, and immune score of OS subtypes. (G) The percentage of immune cells in the three clusters. (H) The significant immune-related functions in the three clusters.

