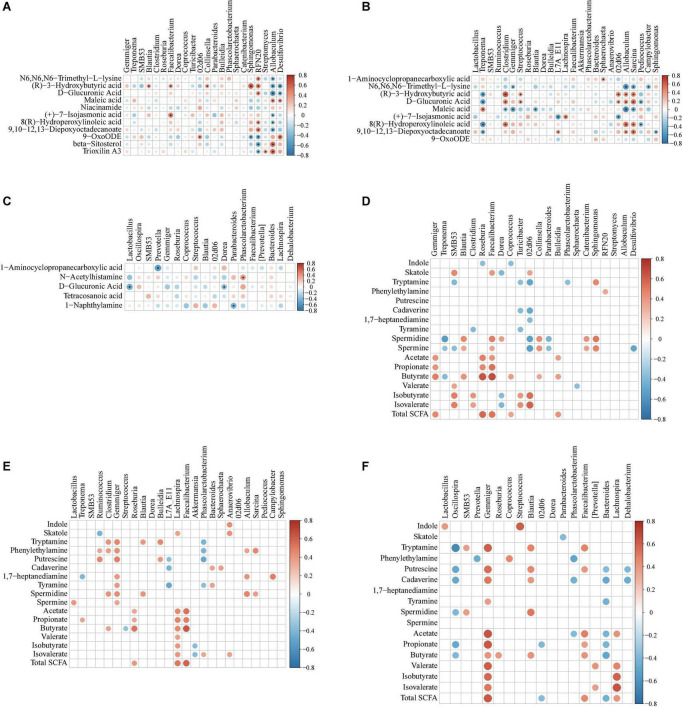
FIGURE 12.
Spearman correlation analysis of different microbiota and metabolites [from metabolomic analysis, (A–C) indole, skatole, SCFAs, and bioamine, (D–F)] in colonic contents of offspring pigs at 65, 95, and 125 days of age, respectively. The red represents positive correlation while the blue represents negative correlation. Asterisk (A–C) and red or blue circle (D–F) represents P-value < 0.05.

