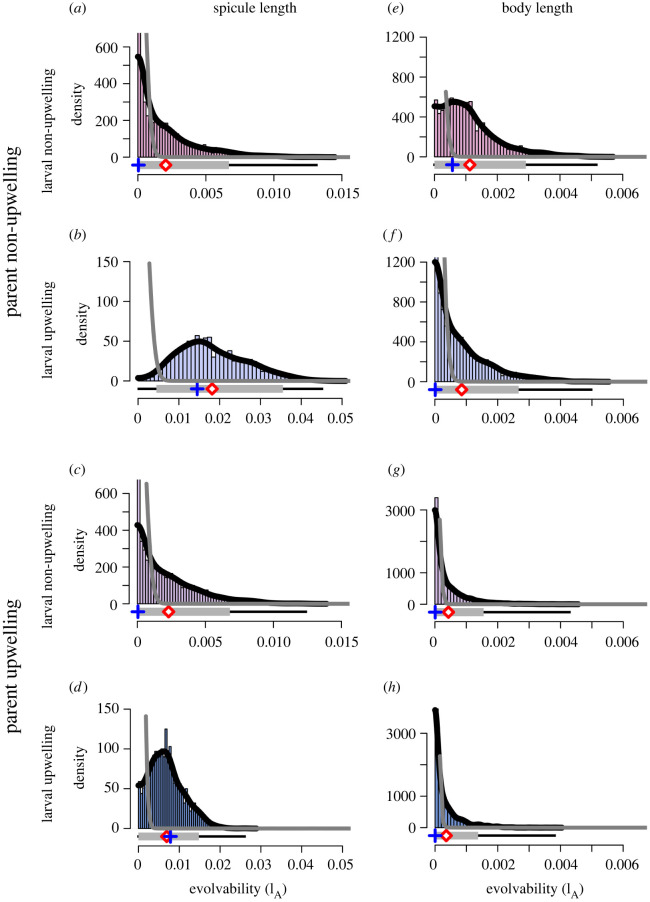
Figure 4.
Evolvability. Strongylocentrotus purpuratus spicule (a–d) and body (e–h) length marginal posterior MCMC samples (histogram bars with sample range depicted underneath by the thin black line), kernel density estimate (black line), posterior mean (red diamond) and mode (blue cross), 95% credible interval (grey bar) and prior density (grey line) for the evolvability (IA). Colours refer to treatment combinations as detailed in figure 1. (Online version in colour.)

