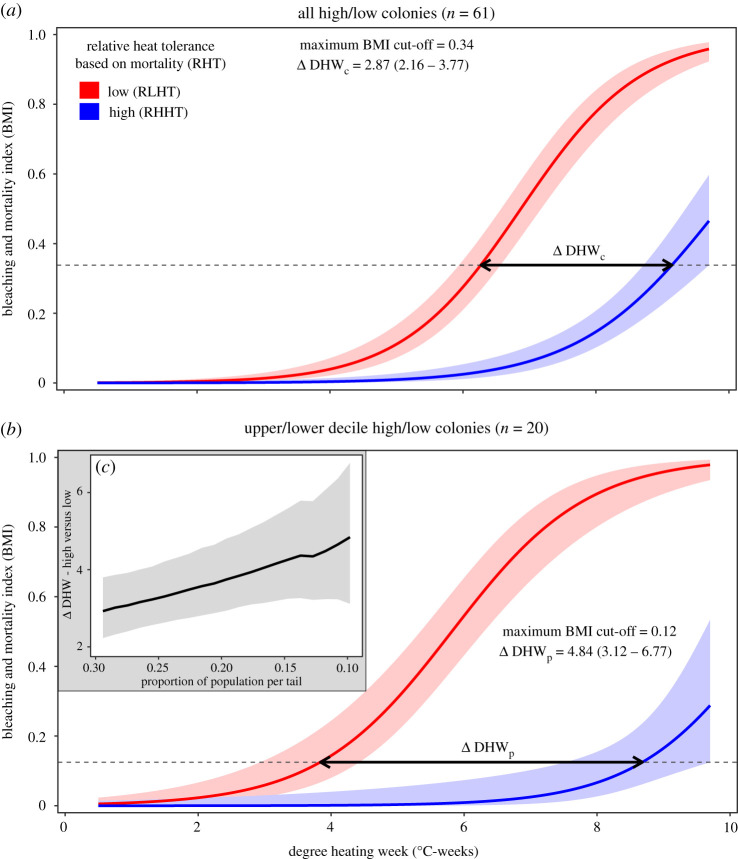
Figure 2.
Quantification of intrapopulation variation in heat tolerance between colonies classified as having low or high RHT based on mortality (RHHT—blue/lower line and RLHT—red/upper line, respectively). Variation is expressed by differential relationships between DHW and the BMI (mean ± 95% confidence intervals). (a,b) Intrapopulation heat tolerance variability is shown as the difference in heat stress tolerated between highs and lows (ΔDHW ± 95% confidence intervals, bold horizontal arrow) for a given phenotypic response (dashed line, the maximum horizontal cut-off that includes all confidence intervals). (a) A conservative estimate of heat tolerance variability (DHWc) was based on the full high/low groups (n = 61 colonies, ΔDHWc = 2.87°C-weeks at BMI = 0.34). This is less than (b) the realized population-level heat tolerance variability (ΔDHWp) quantified from decile population subsamples (n = 20 colonies, ΔDHWp = 4.84°C-weeks at BMI = 0.12). (c) As colonies are subsampled further into the population extremes or tails, the quantified intrapopulation variability in heat tolerance increases beyond 4°C-weeks. (Online version in colour.)

