FIGURE 3.
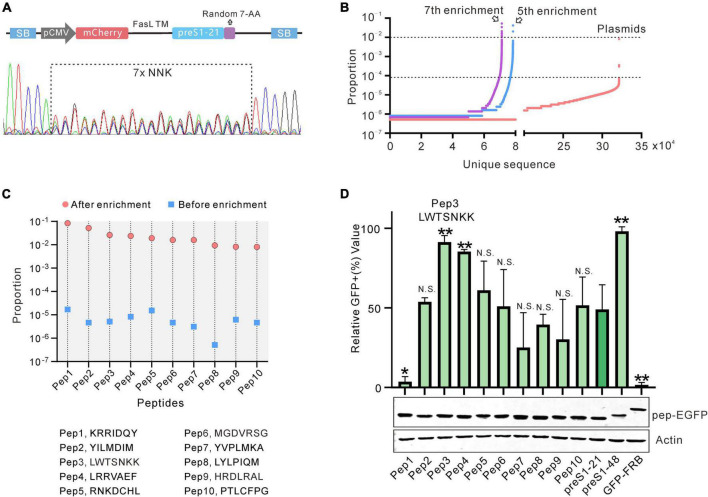
Construction and screening of the random peptide library. (A) Sanger sequencing results of the library (PT4-21 + 7). (B) Deep sequencing results of the initial or enriched sequence. The number of unique sequences (x-axis) and the proportion of each sequence (y-axis) are shown. (C) The 10 sequences with the highest enrichment fold and proportion after 7 rounds of screening. (D) Evaluation of the 10 sequences selected by flow cytometry. The peptides fused with GFP were expressed by HEK293 cells and captured by the cells displaying NTCP-mCherry. Data are shown as means ± SD. Statistical significance was determined using the non-parametric Mann–Whitney U-test (*p < 0.05, **p < 0.01).

