Figure 1.

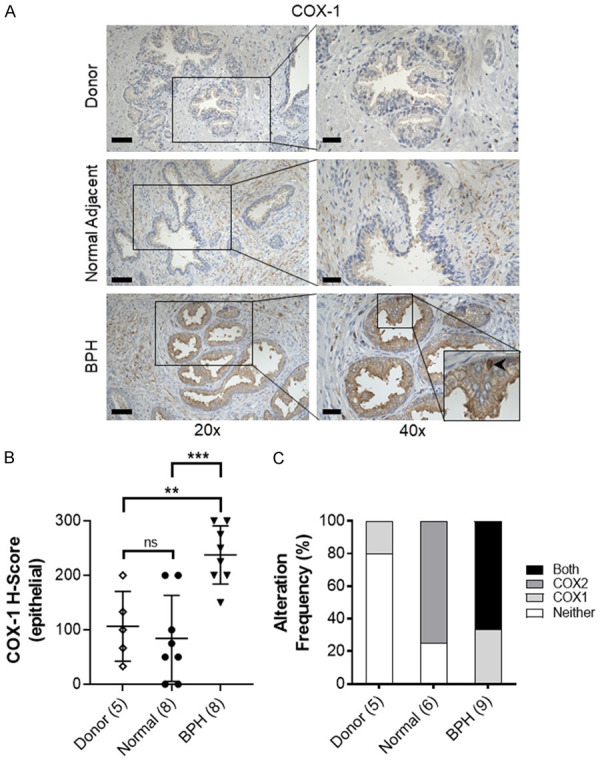
Expression of COX-1 in the prostate. (A) Representative immunostaining of COX-1 (brown) expression in young healthy donor (Donor), normal adjacent to BPH prostate (Normal Adjacent) and BPH specimens. Scale bars indicate 100 µm in 20×, 50 µm in 40×. BPH inset, bottom right, showing nuclear COX-1 staining (black arrow). (B) Quantification of mean COX-1 staining intensity H-score in prostate epithelial cells. (C) Alteration frequency of specimens with no alteration in COX-1 or COX-2 expression (Neither), upregulated COX-1 (COX1), upregulated COX-2 (COX2), or concurrent upregulation of COX-1 and COX-2 in Donor, Normal Adjacent and BPH specimens. Scoring was quantified for patients with both COX-1 and COX-2 immunostaining scores; specimens missing either COX-1 or COX-2 data were not included. Number of patients in parentheses. Data represent mean ± S.D.; ns, not significant, **P < 0.01; ***P < 0.001.
