Figure 4.

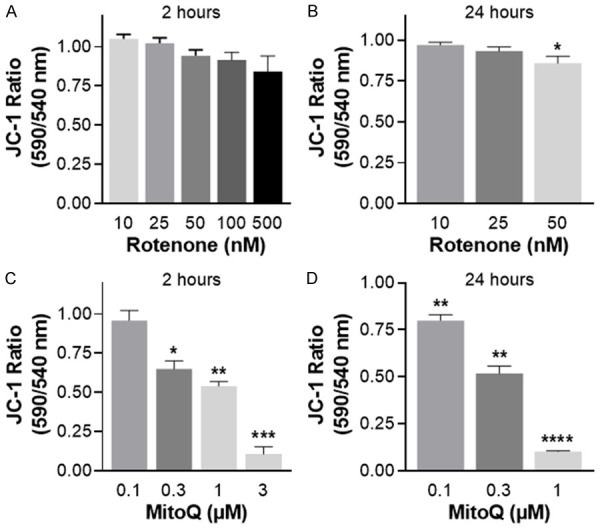
Loss of mitochondrial membrane potential (ΔΨm) induced by rotenone or MitoQ in RWPE-1 cells, measured by quantitative analysis of JC-1 fluorescence. (A) Impact of rotenone treatment after 2 h, or (B) 24 h. (C) Impact of MitoQ treatment after 2 h, or (D) 24 h. Data are expressed relative to untreated control cells 3-4 independent experiments. Data represent mean ± S.E.M. *P < 0.05, **P < 0.01, ***P < 0.001 and ****P < 0.0001.
