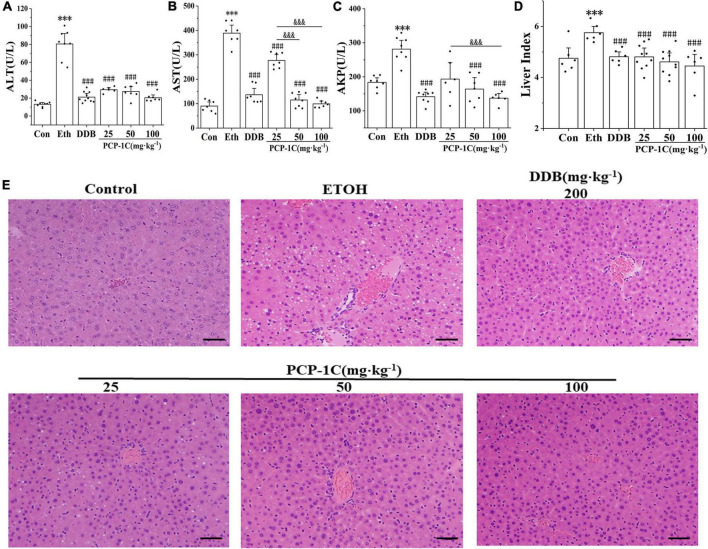
FIGURE 1.
Effect of PCP-1C on general parameters of the ALD mice. (A) The serum levels of ALT, (B) AST, (C) AKP, and (D) mouse liver index. (E) Liver H&E staining of mice in each group (×200, scale 50 μm). The results are presented as mean ± SD (n ≥ 6). ***P < 0.001 vs. the control group; ###P < 0.001 vs. the model group; &&&P < 0.001 represents significance between PCP-1C groups.

