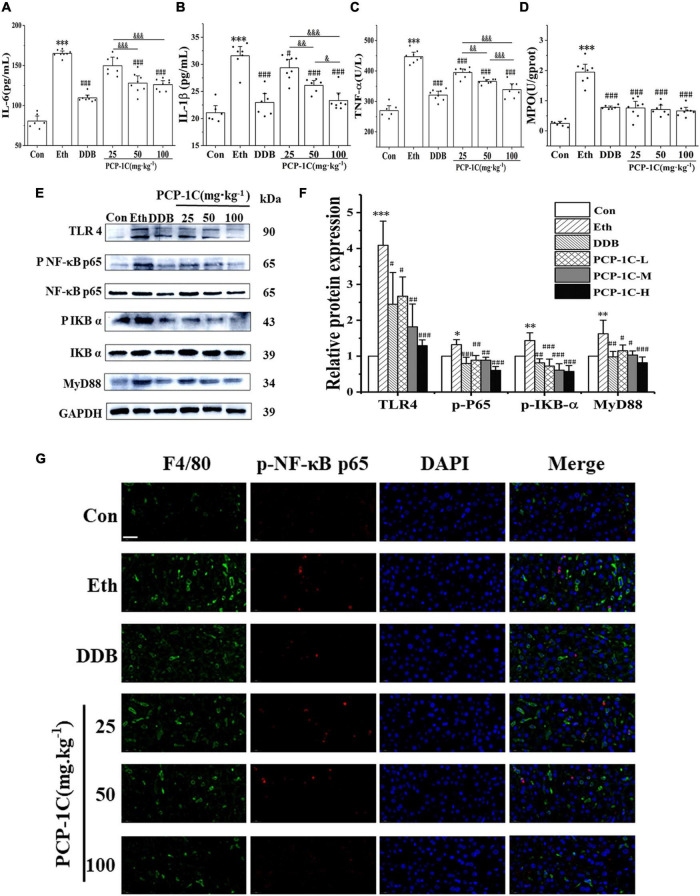
FIGURE 3.
Effects of PCP-1C on inflammatory cytokines and related protein expression in ALD mice. (A) The serum levels of IL-6, (B) IL-1ß, (C) TNF-α, and (D) hepatic MPO levels. (E) Representative immunoblot images of TLR4/NF-κB related protein in liver tissue. (F) Relative protein levels and quantification of TLR4/NF-κB related proteins. (G) Immunofluorescence staining of liver tissue. (Green: F4/80, red: p-NF-κB p65, DAPI: The nucleus, ×400, scale 100 μm). The results are presented as mean ± SD. *P < 0.05, **P < 0.01, ***P < 0.001 vs. the control group; #P < 0.05, ##P < 0.05, ###P < 0.001 vs. the model group. &P < 0.05, &&P < 0.01, &&&P < 0.001 represents significance between PCP-1C groups.

