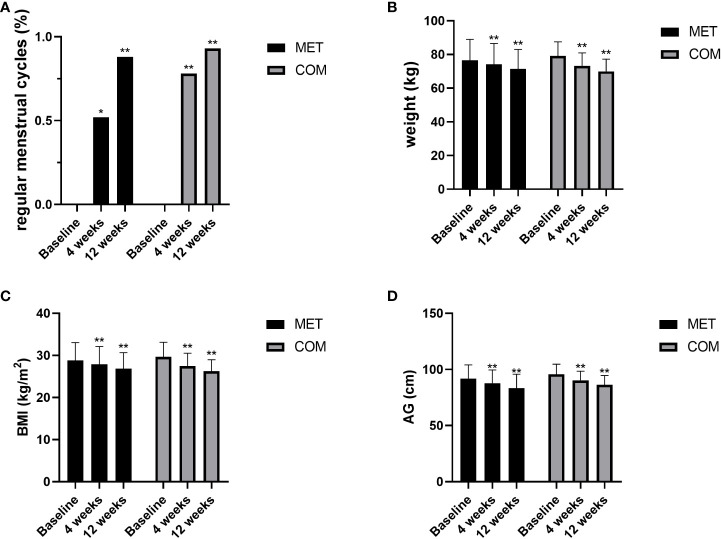
Figure 2.
Changes in menstruation and anthropometric measurements after MET and COM therapy. (A) Changes in menstrual cycles after MET and COM therapy. (B) Changes in weight after MET and COM therapy. (C) Changes in BMI after MET and COM therapy. (D) Changes in AG after MET and COM therapy. MET, metformin; COM, combine; BMI, body mass index; AG, abdominal girth. Results are expressed as mean ± SD; * P < 0.05, ** P < 0.01 (vs. before treatment in each group).

