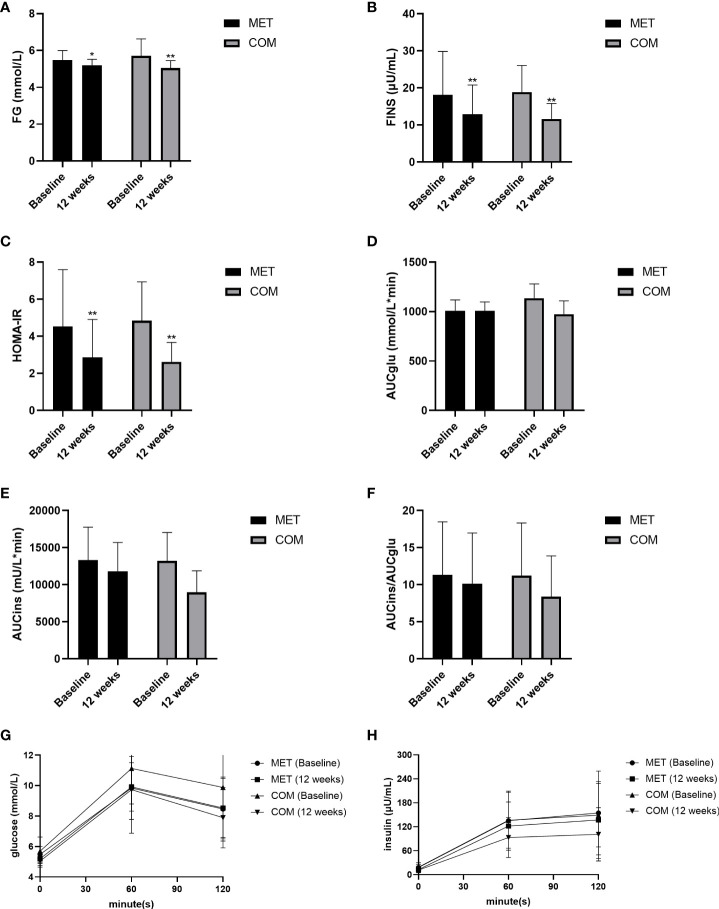
Figure 3.
Changes in metabolic parameters after MET and COM therapy. (A) Changes in FG after MET and COM therapy. (B) Changes in FINS after MET and COM therapy. (C) Changes in HOMA-IR after MET and COM therapy. (D) Changes in AUCglu after MET and COM therapy. (E) Changes in AUCins after MET and COM therapy. (F) Changes in AUCglu/AUCins after MET and COM therapy. (G) Changes in OGTT (glucose) after MET and COM therapy. (H) Changes in OGTT (insulin) after MET and COM therapy. MET, metformin; COM, combine; FG, fasting glucose; FINS, fasting insulin; HOMA-IR, homeostasis model assessment-insulin resistance; AUCglu, area under the curve (AUC) for glucose; AUCins, AUC for insulin. Results are expressed as mean ± SD; * P < 0.05, ** P < 0.01 (vs. before treatment in each group).

