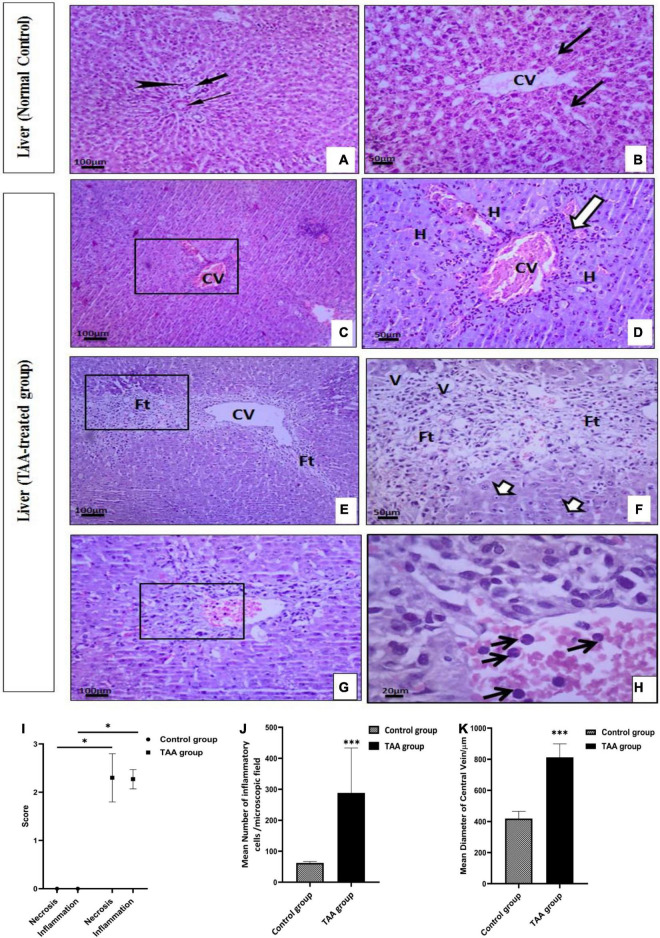
FIGURE 2.
(A–H) Liver sections of control and TAA-treated groups stained with hematoxylin and eosin: (A,B) Control group. (A) Portal tract with normal portal venule (thin arrow), hepatic arteriole (arrowhead), and bile ductile (thick arrow). (B) Typical liver architecture with hepatic lobule-containing central vein (CV) and radiating hepatocytes cords with blood sinusoids (arrows) in between. (C–H) TAA-treated groups. (C,D) Dilation and congestion of CV (arrowheads) surrounded by inflammatory cell infiltrations (arrow) and hydropic degeneration of hepatocytes (H). (E,F) Dilated CV is surrounded by massive fibrous tissue proliferation (Ft) associated with vacuolar degeneration (V) and nuclear pyknosis (short arrows). (G,H) Necrotic centrilobular area (rectangle) with inflammatory cell infiltration (arrow). X100 bar 100, X 400 bar 50 and X: 1,000 bar 20. (I) The graph represents hepatocyte necrosis and the extent of inflammatory cell infiltration. Data are expressed as mean ± SD. *p < 0.01 vs. control group. (J) The mean number of inflammatory cells/microscopic field. Data are displayed as mean ± SD. ***p < 0.001 vs. control group. (K) The mean diameter of the ventral vein (μm). Data are displayed as mean ± SD. ***p < 0.001 vs. control group.

