FIGURE 4.
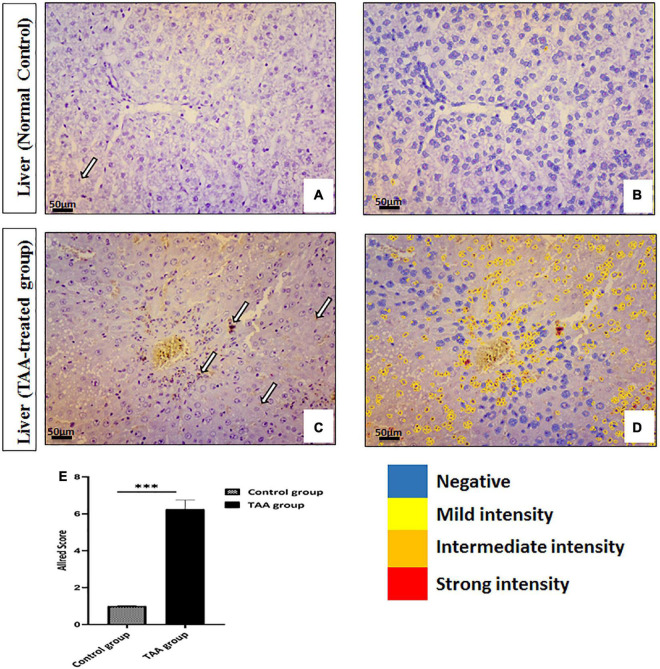
(A–D) Liver sections of control and TAA-treated groups stained with ki-67. (A,B) Control groups. (A) Very rare immunopositive hepatocytes (arrow). (B) Quantitative analysis of cells showing negativity and mild intensity. (C,D) TAA-treated groups. (C) An increased number of immunopositive nuclei of hepatocytes (arrows). (D) Quantitative analysis of cells showing different intensities varying from mild to strong. X: 400 bar 50. (E) Allred immunohistochemical scoring system. Data are expressed as mean ± SD. 0–1 (negative), 2–3 (mild), 4–6 (moderate), and 7–8 (strong). ***p < 0.001 vs. control group.

