FIGURE 5.

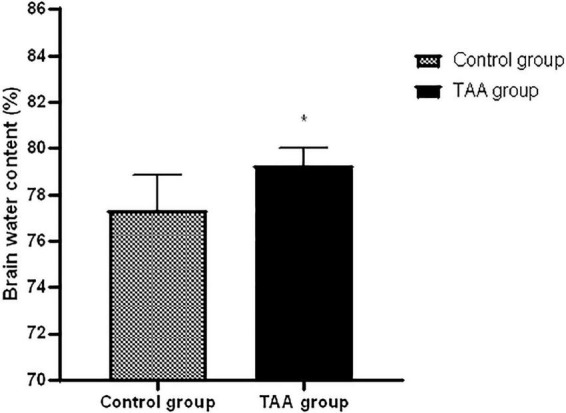
Mean ± SD values of brain water in treated groups. *p < 0.05 is significantly different in the TAA-treated group compared to the control group.

Mean ± SD values of brain water in treated groups. *p < 0.05 is significantly different in the TAA-treated group compared to the control group.