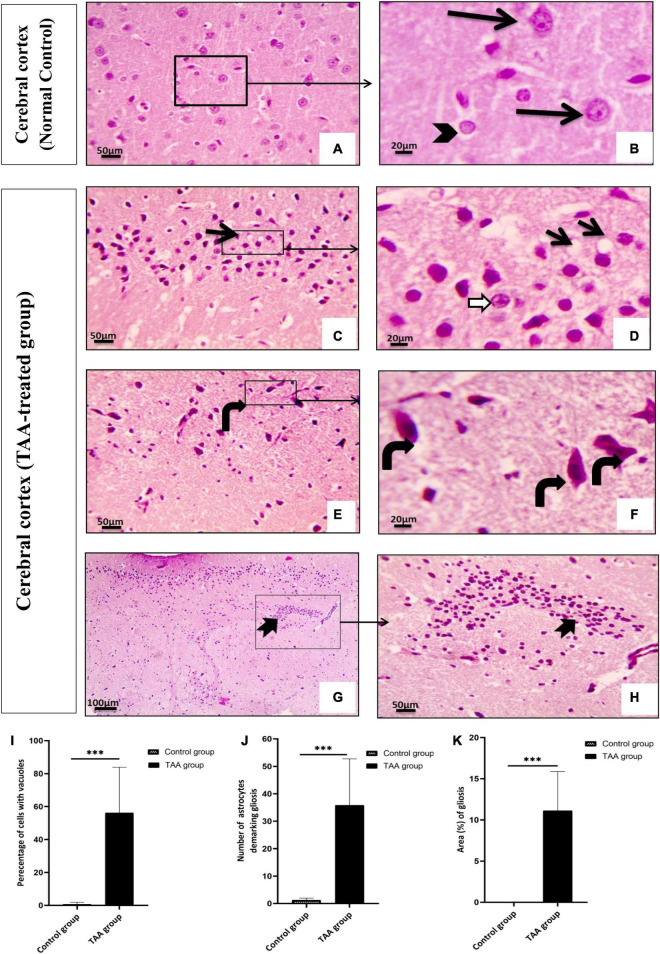
FIGURE 6.
(A–H) The cerebral cortex of control and treated groups stained with (H&E). (A) Control group exhibiting the normal texture of the neuropil between the neurons. (B) Higher magnifications of the control group showing normal pyramidal neurons with their large nuclei and prominent nucleoli, basophilic cytoplasm (black arrows), normal astrocytes having larger round nuclei with pale vesicular chromatin patterns and indistinct nucleoli (arrowhead). (C–H) Cerebral cortical sections from the TAA-treated group. (C,D) Neuropil vacuolation (short arrows) and astrocytes with enlarged and relatively clear nuclei (white arrows). (E,F) Severely affected neurons with prominent eosinophilic cytoplasm and nuclear pyknosis (curved arrows). (G,H) Focal gliosis (bifid arrow). X: 400 bar 50 and X: 1000 bar 20. (I) Quantitative analysis showing the percentage of cells with vacuoles. (J) Graph showing number of astrocytes demarking gliosis and (K) showing area percentage of gliosis. Values represent mean ± SD (***p < 0.001 vs. control group).

