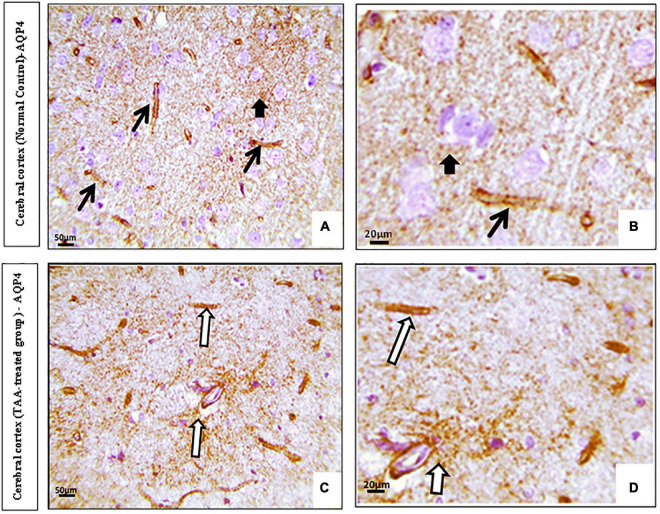
FIGURE 9.
(A,D) Microscopic pictures of immunostained cerebral cortical sections against (AQP4) of control and treated groups. (A,B) Control group showing expression (black arrows) in the blood vessels and membranes of astrocytes (short arrow). (C,D) Cerebral cortical sections from the TAA-treated group showing increased positively brown stained blood vessels (white arrows). X: 400 bar 50 and X: 1000 bar 20.

