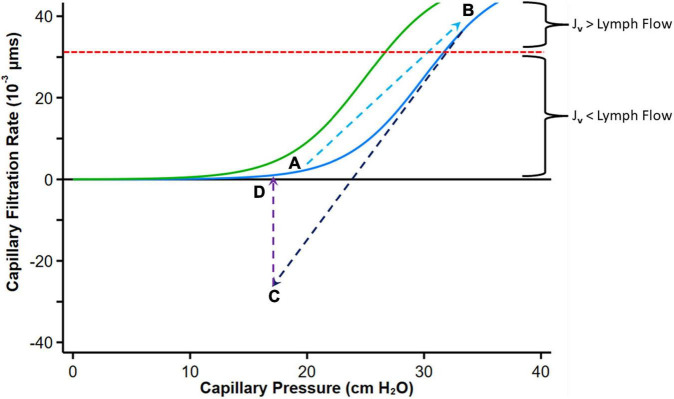
FIGURE 5.
Graph depicting fluid exchange (filtration or absorption rate, Jv) across the capillary wall as a function of capillary pressure. Point A represents a normal steady state position with minimal filtration. With heart failure decompensation, fluid and salt retention cause an increase in mean capillary pressure, leading to an increase in fluid absorption into the interstitial compartment and a reduction in plasma COP which shifts the curve to the left (Green curve, Point B). Diuretic therapy reduces capillary pressure with reversal to fluid absorption into the intravascular compartment (Point C). If diuresis is brief, the absorption rate falls and can move again toward Point B. Fluid uptake into the intravascular compartment has a variable effect on plasma protein concentration depending on the relative rates of diuresis and plasma refill rates. When diuresis increases the interstitial COP, the colloid osmotic pressure difference declines and reduces absorption of fluid into the capillaries (Point D). The red dashed line indicates the point where the maximal removal capacity of lymph flow cannot compensate for the increased capillary filtration. Modified from references (61, 65, 66). See text for details.

