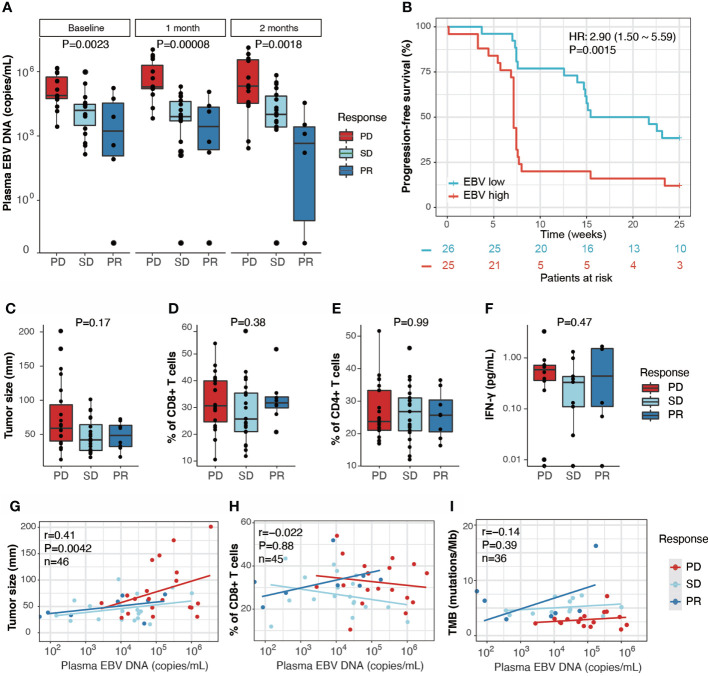
Figure 2.
Plasma EBV DNA load is associated with response to anti-PD1 immunotherapy in RM-NPC patients. (A) Distribution of plasma EBV DNA copy number quantified by real-time polymerase chain reaction (qPCR) in PR (n=7), SD (n=19) and PD (n=25) patients. Plasma EBV DNA was assessed before treatment (Baseline) and post-treatment (1 month, 2 months). P values were calculated by using the Kruskal-Wallis test. (B). Progression-free survival analysis of patients with high plasma EBV DNA (>50,000 copies/mL, EBV high, n=25) and low plasma EBV DNA (<50,000 copies/mL, EBV low, n=26) at baseline. (C–F) Boxplots showing the distribution of tumor size (C), % blood CD8+ T cells amongst peripheral mononuclear cells (D), % blood CD4+ T cells amongst peripheral mononuclear cells (E), and blood IFN-γ (F) in the PD, SD and PR patients before treatment. P values were calculated by using the Kruskal-Wallis test. (G–I) Scatter plots of Pearson’s correlation coefficients between plasma EBV DNA and tumor size (G), blood CD8+ T cells (H) and TMB (I), PD, SD and PR patients were assessed separately.

