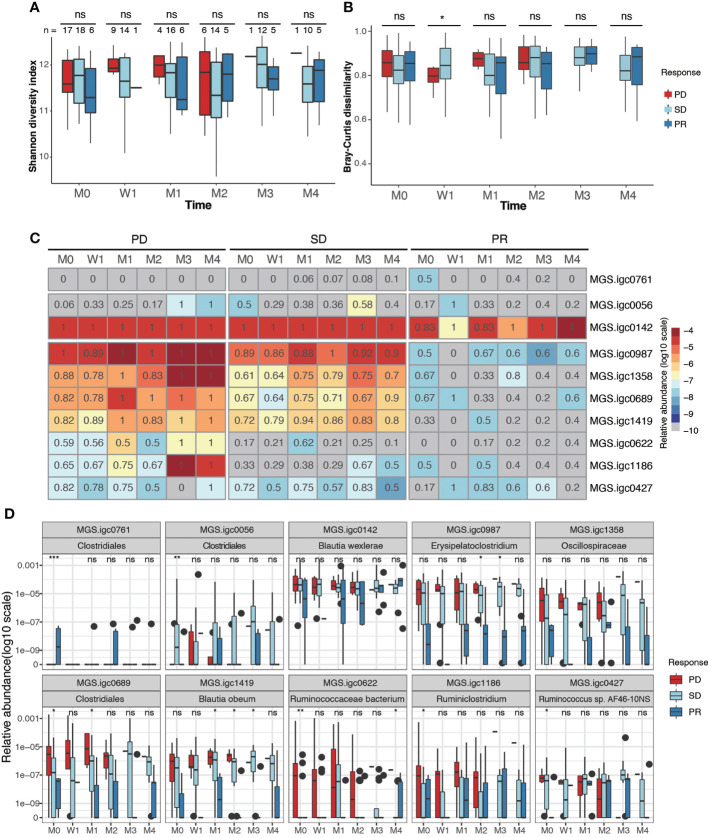
Figure 3.
Identification of gut bacterial species associated with clinical response to anti-PD-1 therapy. (A, B). Box plots showing Shannon alpha diversity (A) and Bray-Curtis dissimilarity (B) based on MGSs in fecal samples collected from PD, SD and PR patients during different stages of anti-PD-1 therapy. (C) Relative abundance (color) and prevalence (numerals) of differentially abundant MGSs among PR, SD and PD groups before treatment, as defined by analysis of variance (ANOVA). The color represents the median value (log10) of relative abundance within the response group. The prevalence rate is indicated as a numeral within the box. (D) Box plots showing the relative abundance of MGSs that exhibit differential abundance between groups. P values were calculated using the Kruskal-Wallis test (ns, non-significant; *P < 0.05; **P < 0.01; ***P < 0.001). M0: pre-therapy, W1: one-week post-treatment, M1-M4: 1-4 months post-treatment.

