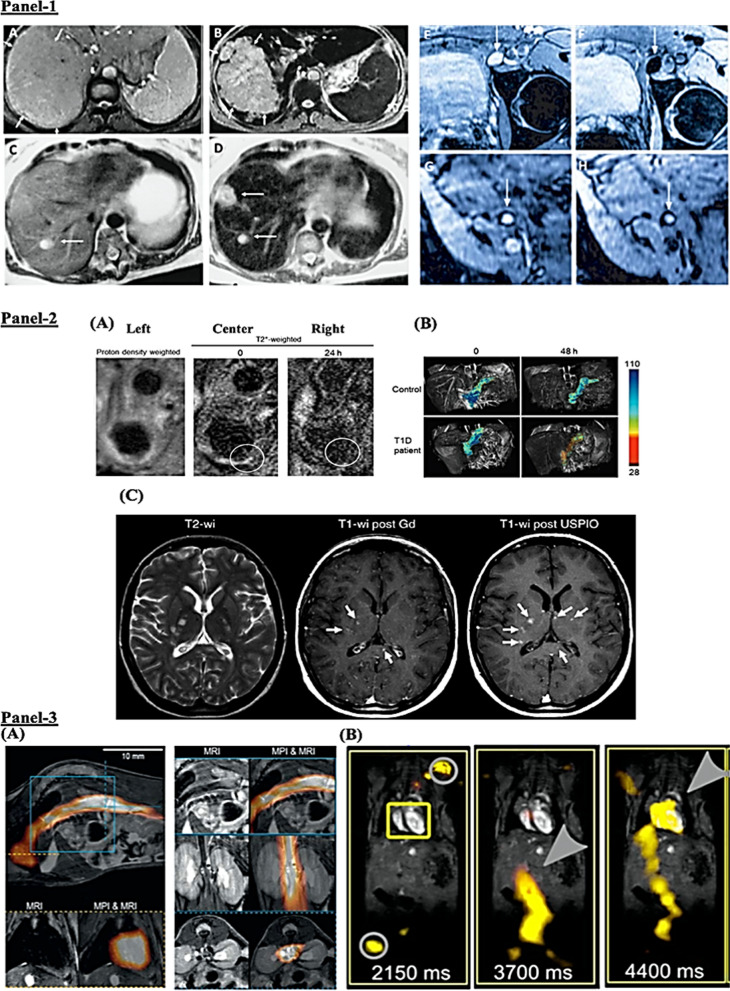
Fig. 5.
Functionalized MNPs (SPION, USPIO)-based anatomical imaging of human diseases. Panel 1: Liver imaging. A–D Weighted magnetic resonance imaging of liver hepatocellular carcinoma demarcated with arrows in healthy (A) and in disease (B) standard imaging (C) vs. functionalized SPION-based enhanced (D) imaging of liver metastasis (marked by pointed arrows) in a patient with colorectal cancer. Lymph node imaging. E–H Imaging of lymph nodes in left iliac region in metastatic infiltration before (E, G) and after (F, H) ferumoxtran administration. G Indicates high UPIO macrophage uptake with arrowheads pointing at no metastasis whereas, H presents lack of drug trafficking with persistent metastasis (arrow head). Panel 2: Imaging Inflammation with USPIOs. A Imaging of external, internal carotid artery (ECA, ICA) in atherosclerosis. T2*-weighted MR images prior (center) and after 24 h (right) of administration (i.v.) of functionalized USPIONs. Decreased signal (circled) around the vessel wall at 24 h. B USPIO-based pancreatic imagining in diabetes. MR images showing SPION accumulation in a Type 1 diabetic (T1D) patient vs. healthy individual. Alterations in the pancreatic microvasculature due to insulitis cause leakage of USPIO particles that can be detected in the inflamed tissue by magnetic resonance imaging. C Contrast differences between nanoparticles (functionalized USPION vs. and gadolinium-based) in MRI imaging in multiple sclerosis (MS). Left, multiple hyperintense lesions in the non-contrast-enhanced T2-weighted image. Center, gadolinium-based imaging showing lesions (three arrows). Right, functionalized USPION-based imaging showing six lesions (three additional arrows), highlighting added value for disease diagnosis. Panel 3: MR imaging with SPION magnetic particles. Functionalized circulating SPION (ferucarbotran-based) visualized with anatomical information. A Image showing SPION circulating through the heart. The top and bottom right images indicate presence in inferior vena cava (sagittal, coronal and transverse orientation). B In vivo measurement from a beating mouse heart by MRI and overlaid with traveling wave MPI data. No signal detected at 2150 m post i.v. injection of ferucarbotran-based SPION (yellow box), whereas, grey circle indicates the signal of the marker points. Presence of SPIONS in the artery a leading and targeting to the heart 3700 ms, and at 4400 ms. (Reproduced and adapted with permission from Dadfar et al. [91])

