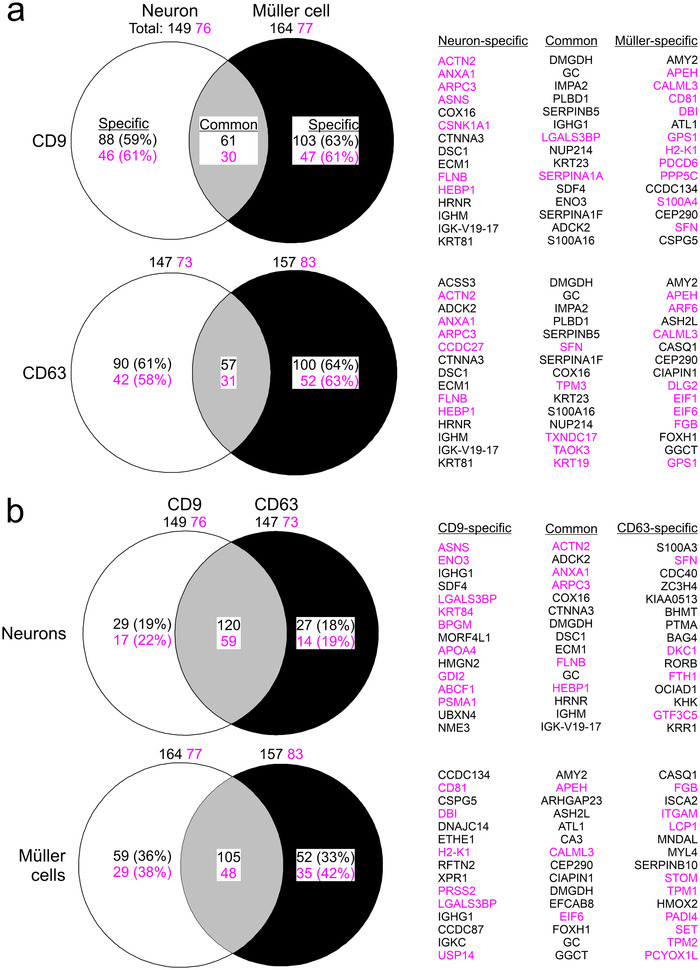
FIGURE 10.

Diversity of neuron‐ and Müller cell‐derived EVs based on protein content Venn diagrams showing differences and overlaps in protein content between neurons and Müller cells for CD9‐ (top) and CD63‐positive (bottom) EVs (a) and between CD9‐ and CD63‐positive EVs from neurons (top) and from Müller cells (bottom) (b). Numbers indicate counts of all proteins that were detected in respective samples (total), that were present in both samples (common) and that were only present in either sample (specific). Indicated percentages were calculated compared to total number of detected proteins. Names of specific and common proteins showing highest enrichment in EVs compared to lysate (top 15) are indicated on the right. Numbers and names in magenta highlight established EV components listed in the Vesiclepedia database.
