Fig 4.
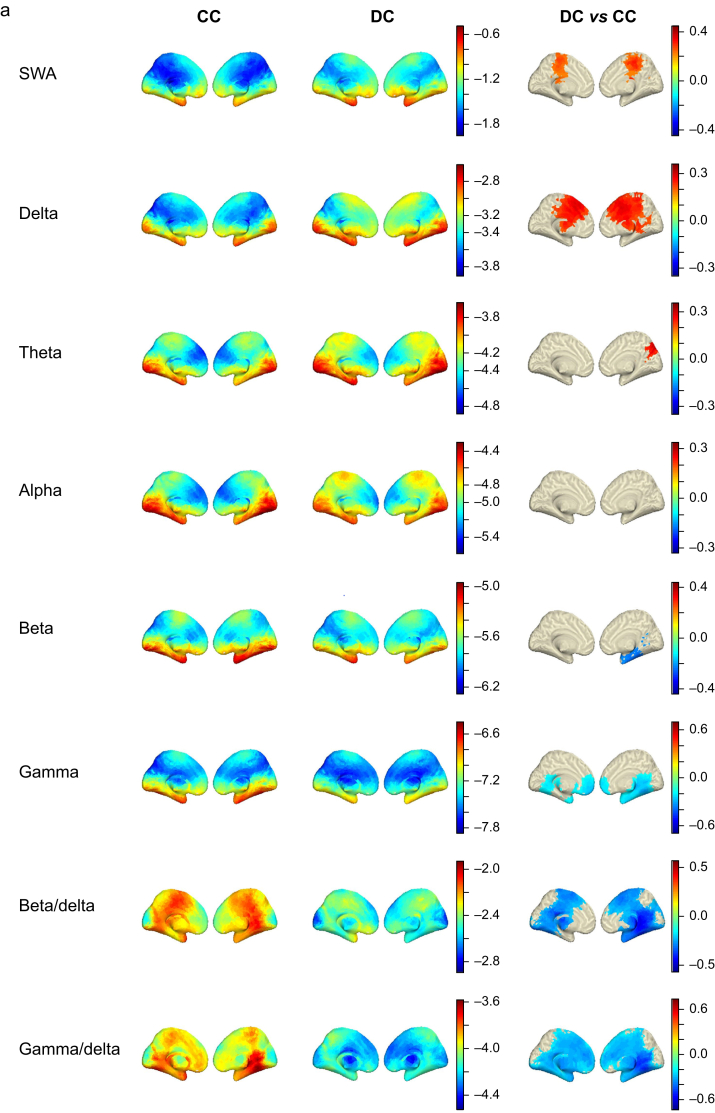
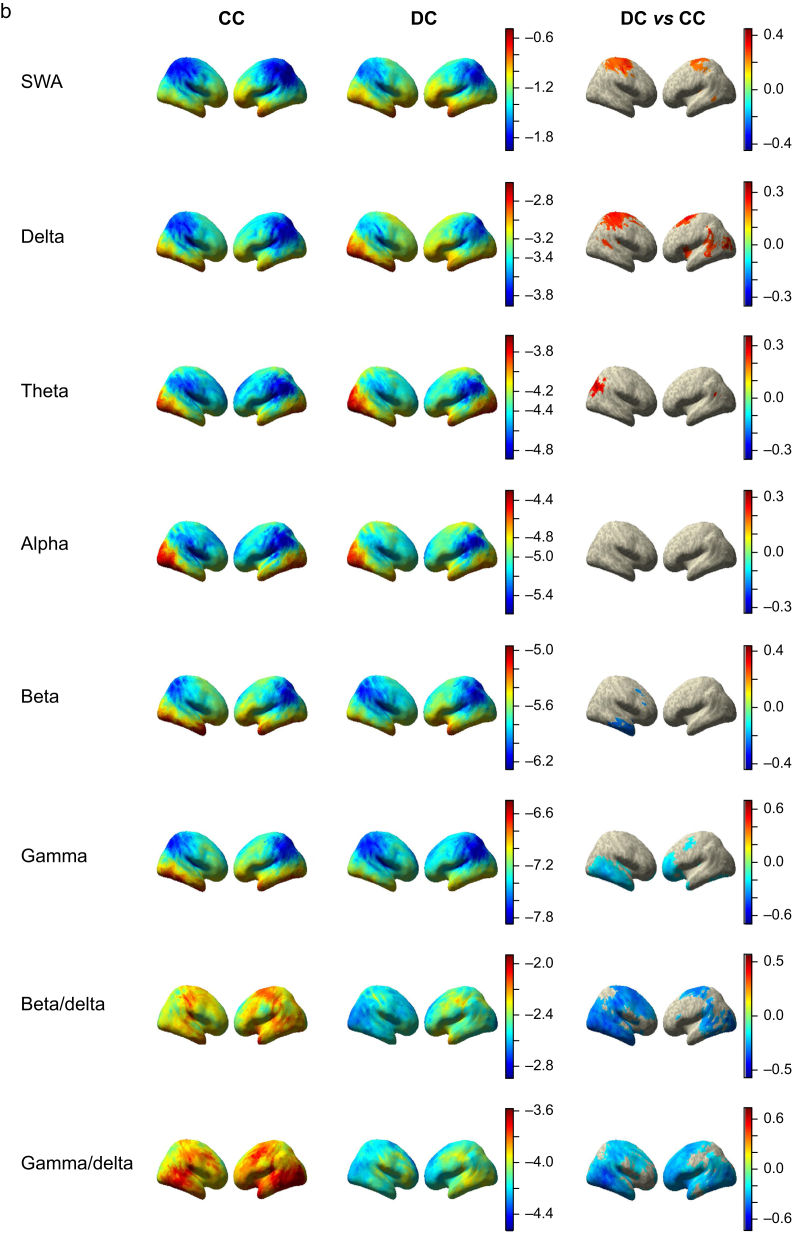
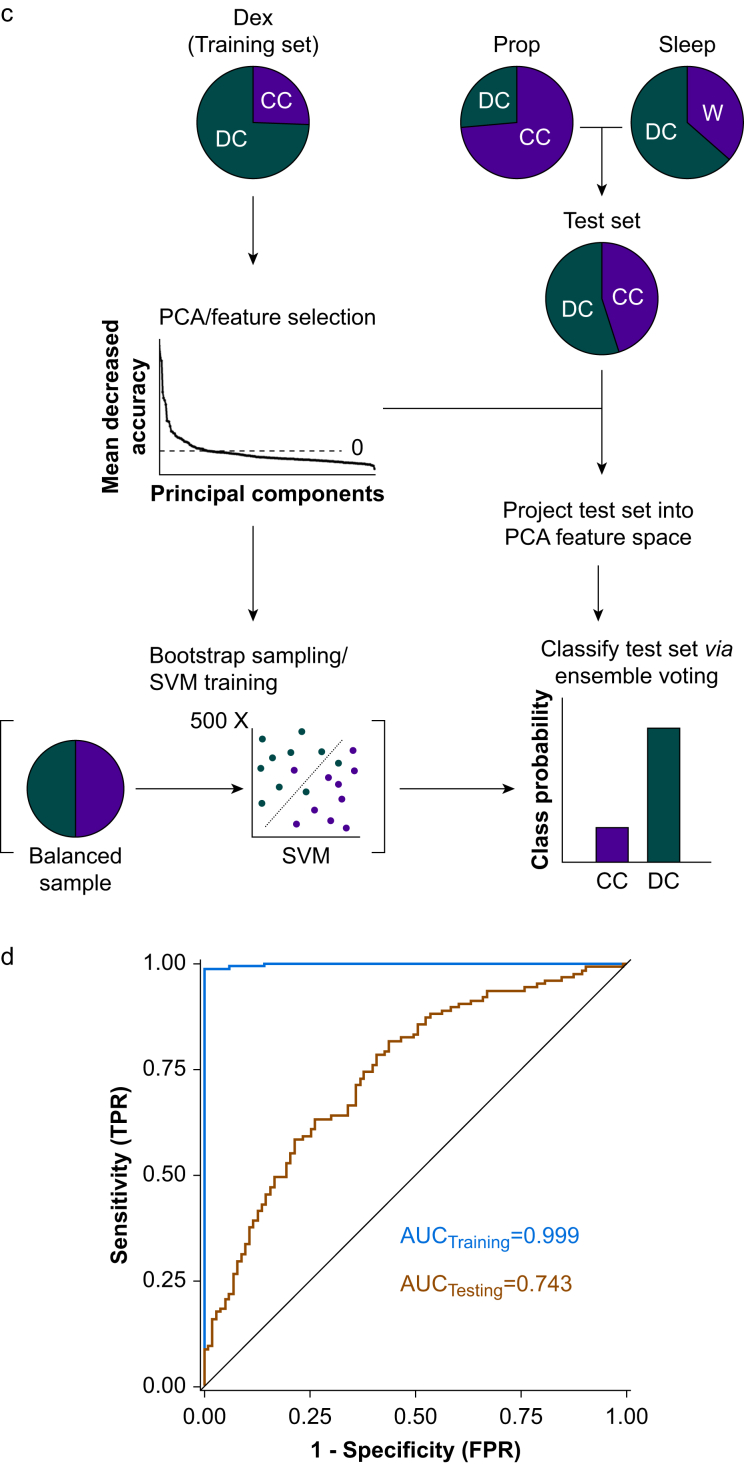
Disconnected consciousness compared with connected consciousness across frequency bands. a: Medial view of voxel-wise predicted power (log10 scale colour coded) from LMEMs for CC (left column) and DC (middle column) across frequency bands. Right column shows differences between DC and CC states for all significant voxels after FDR correction for multiple comparisons. b: Same as in (a) but showing lateral view. c: Depiction of machine learning approach used to classify DC and CC data. Briefly, Dex data were used as a training set and subjected to PCA for dimensionality reduction before feature selection. The Prop and Sleep test data were projected into the same feature space. Training features were used to generate an ensemble of 500 SVMs, each trained using a different subset of the training data, bootstrap sampled with balanced class representation. The ensemble was applied to the test data by averaging the probability scores of all 500 models and selecting the class with the higher average probability. d: ROC curves for the ensemble learner, training using all bands except alpha, applied to the training set and test set with AUC quantification. The black line represents chance performance (AUC=0.5). AUC, area under the curve; CC, connected consciousness; DC, disconnected consciousness; Dex, dexmedetomidine; FDR, false discovery rate; LMEM, linear mixed effects model; PCA, principal component analysis; Prop, propofol; ROC, receiver operating characteristic; SVM, support vector machine; SWA, slow-wave activity.


