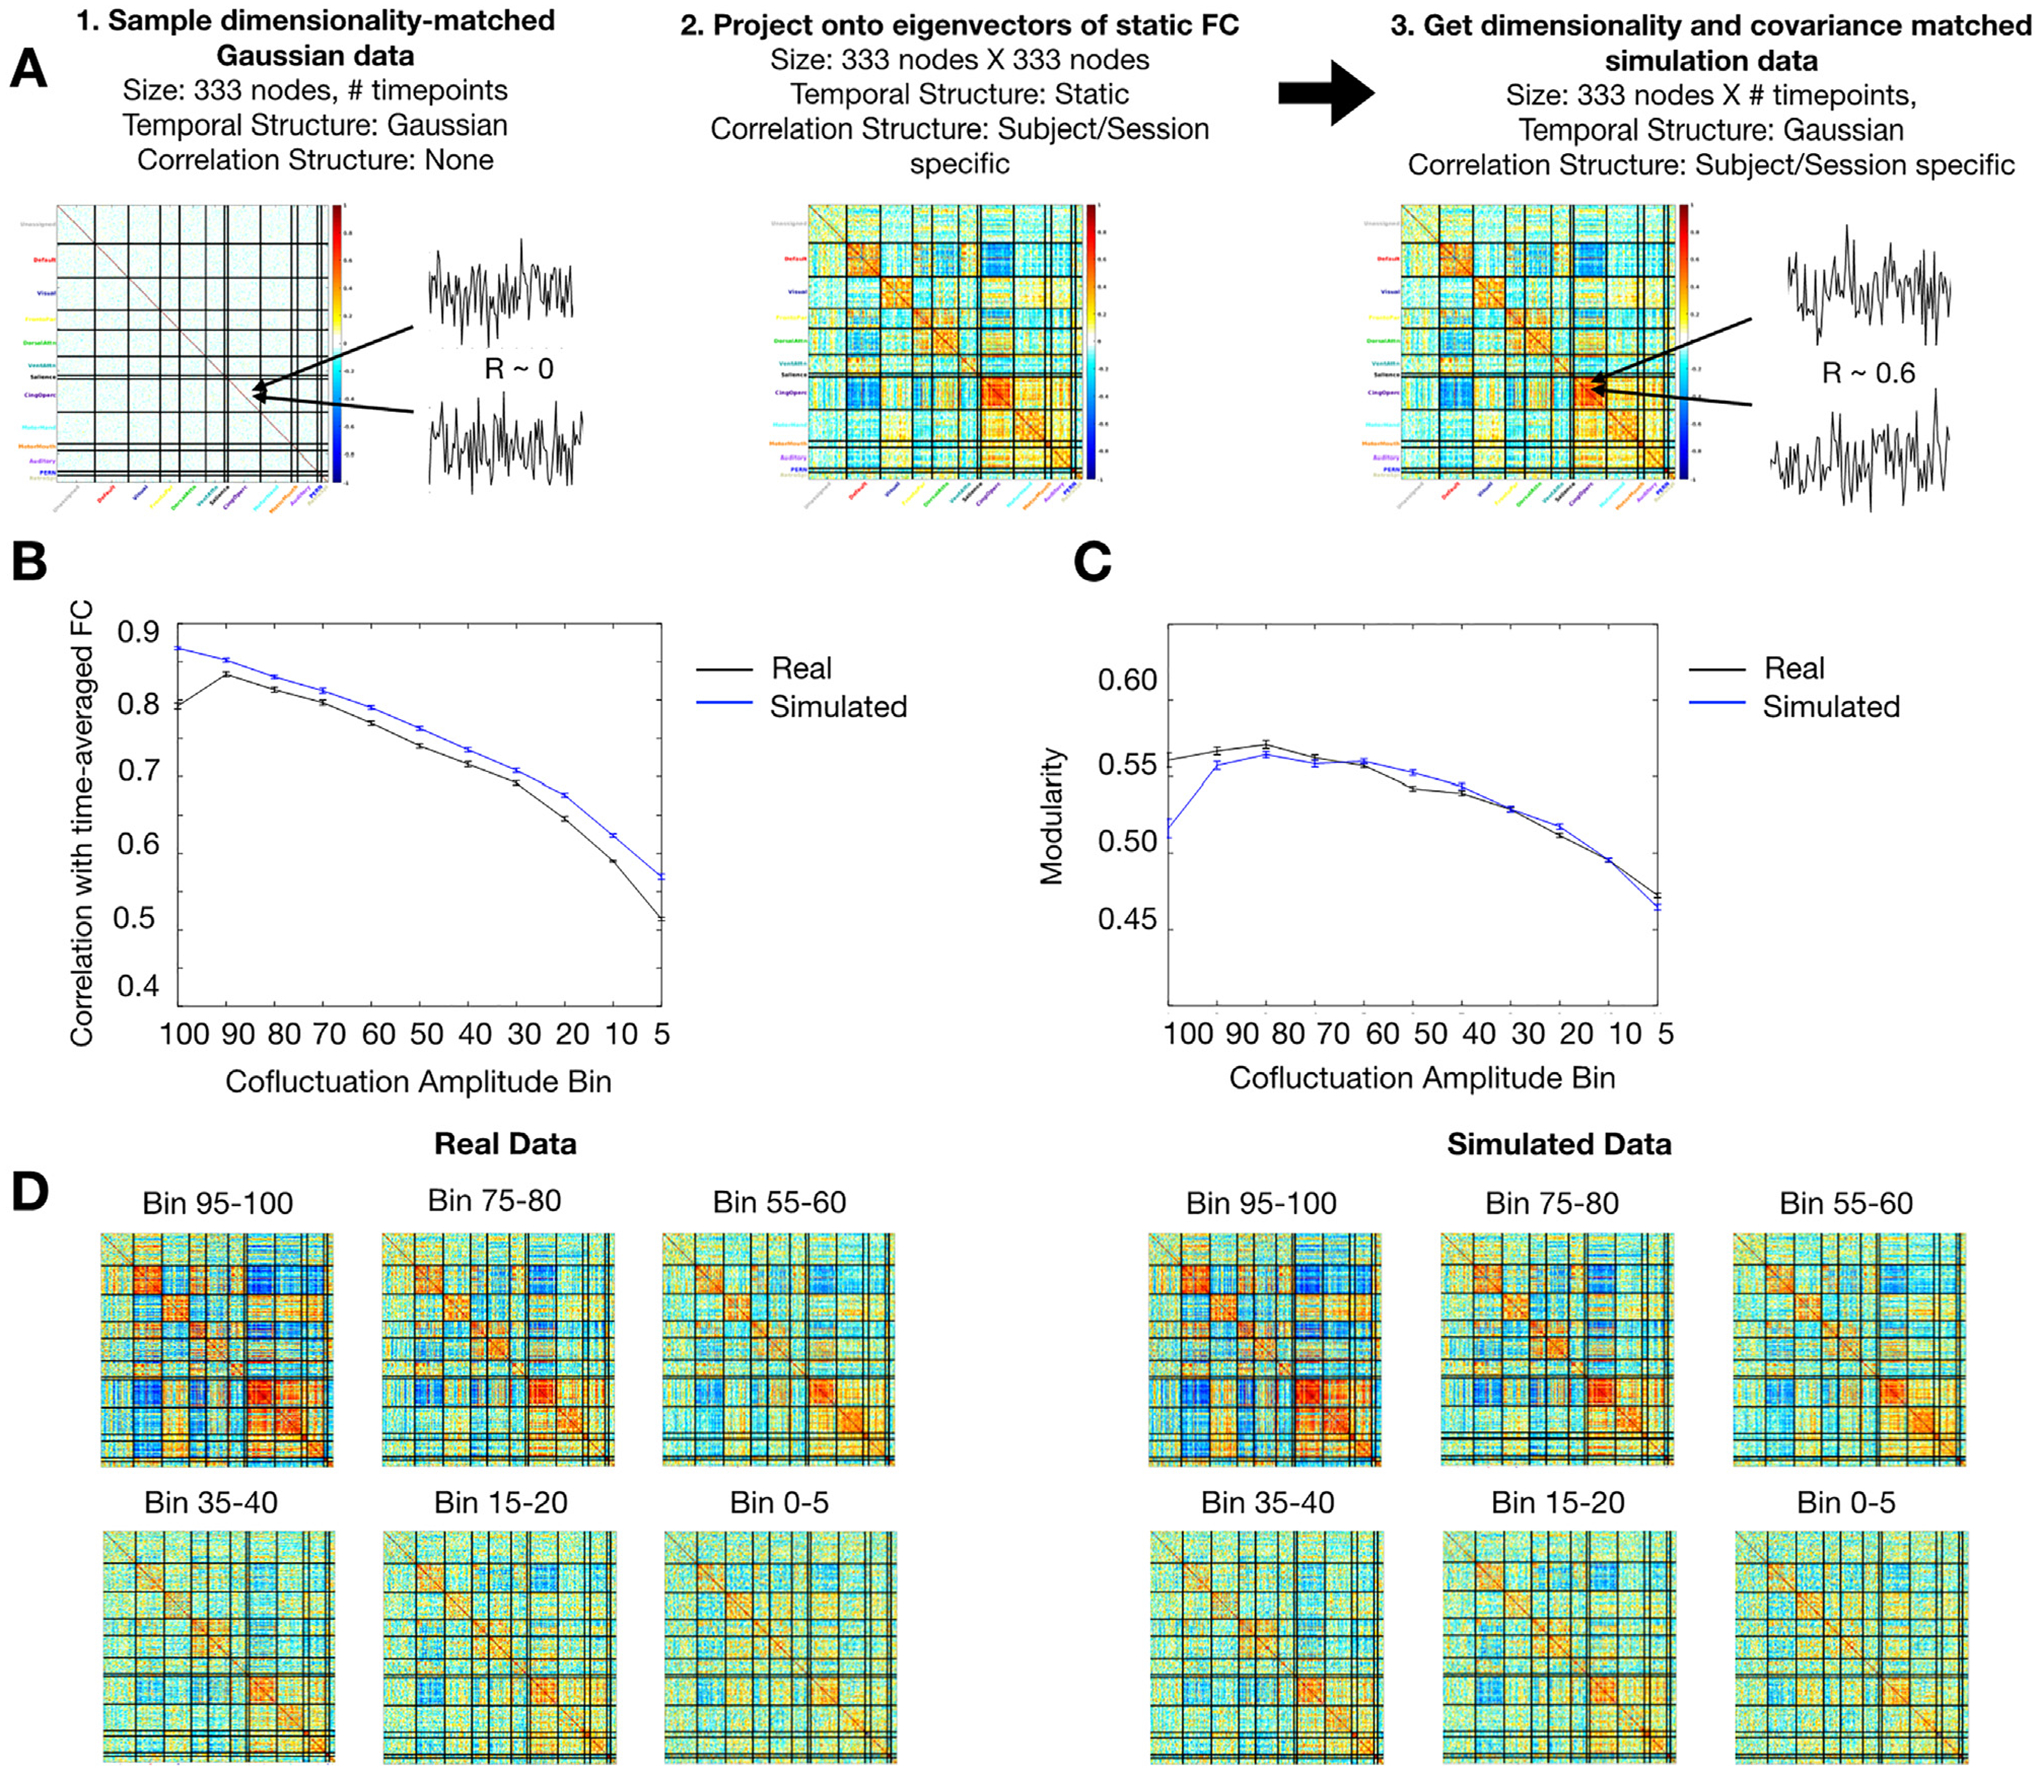
Fig. 2.

Sampling variability alone can produce event-like behavior. (A) For each subject and session, we generated a dimensionality-matched timeseries sampled from a Gaussian distribution. This time series was projected onto the eigenvectors of static FC calculated from that session. This yielded a simulated random Gaussian data set with BOLD-matched dimensionality and covariance structure. (B, C) Using the same analysis methods as in Fig. 1, we found that the relationship between network structure and cofluctuation in simulated data was remarkably similar to the one found in real data. Both (B) similarity with session FC and (C) modularity increased gradually just as they did in real data. (D) Visually, the FC matrices made from specific cofluctuation bins look similar between simulated and real data. The data shown is an example from a single session: MSC02 Session 5. These results suggest the relationship between network structure and cofluctuation amplitude can be explained by sampling variability and static FC.
