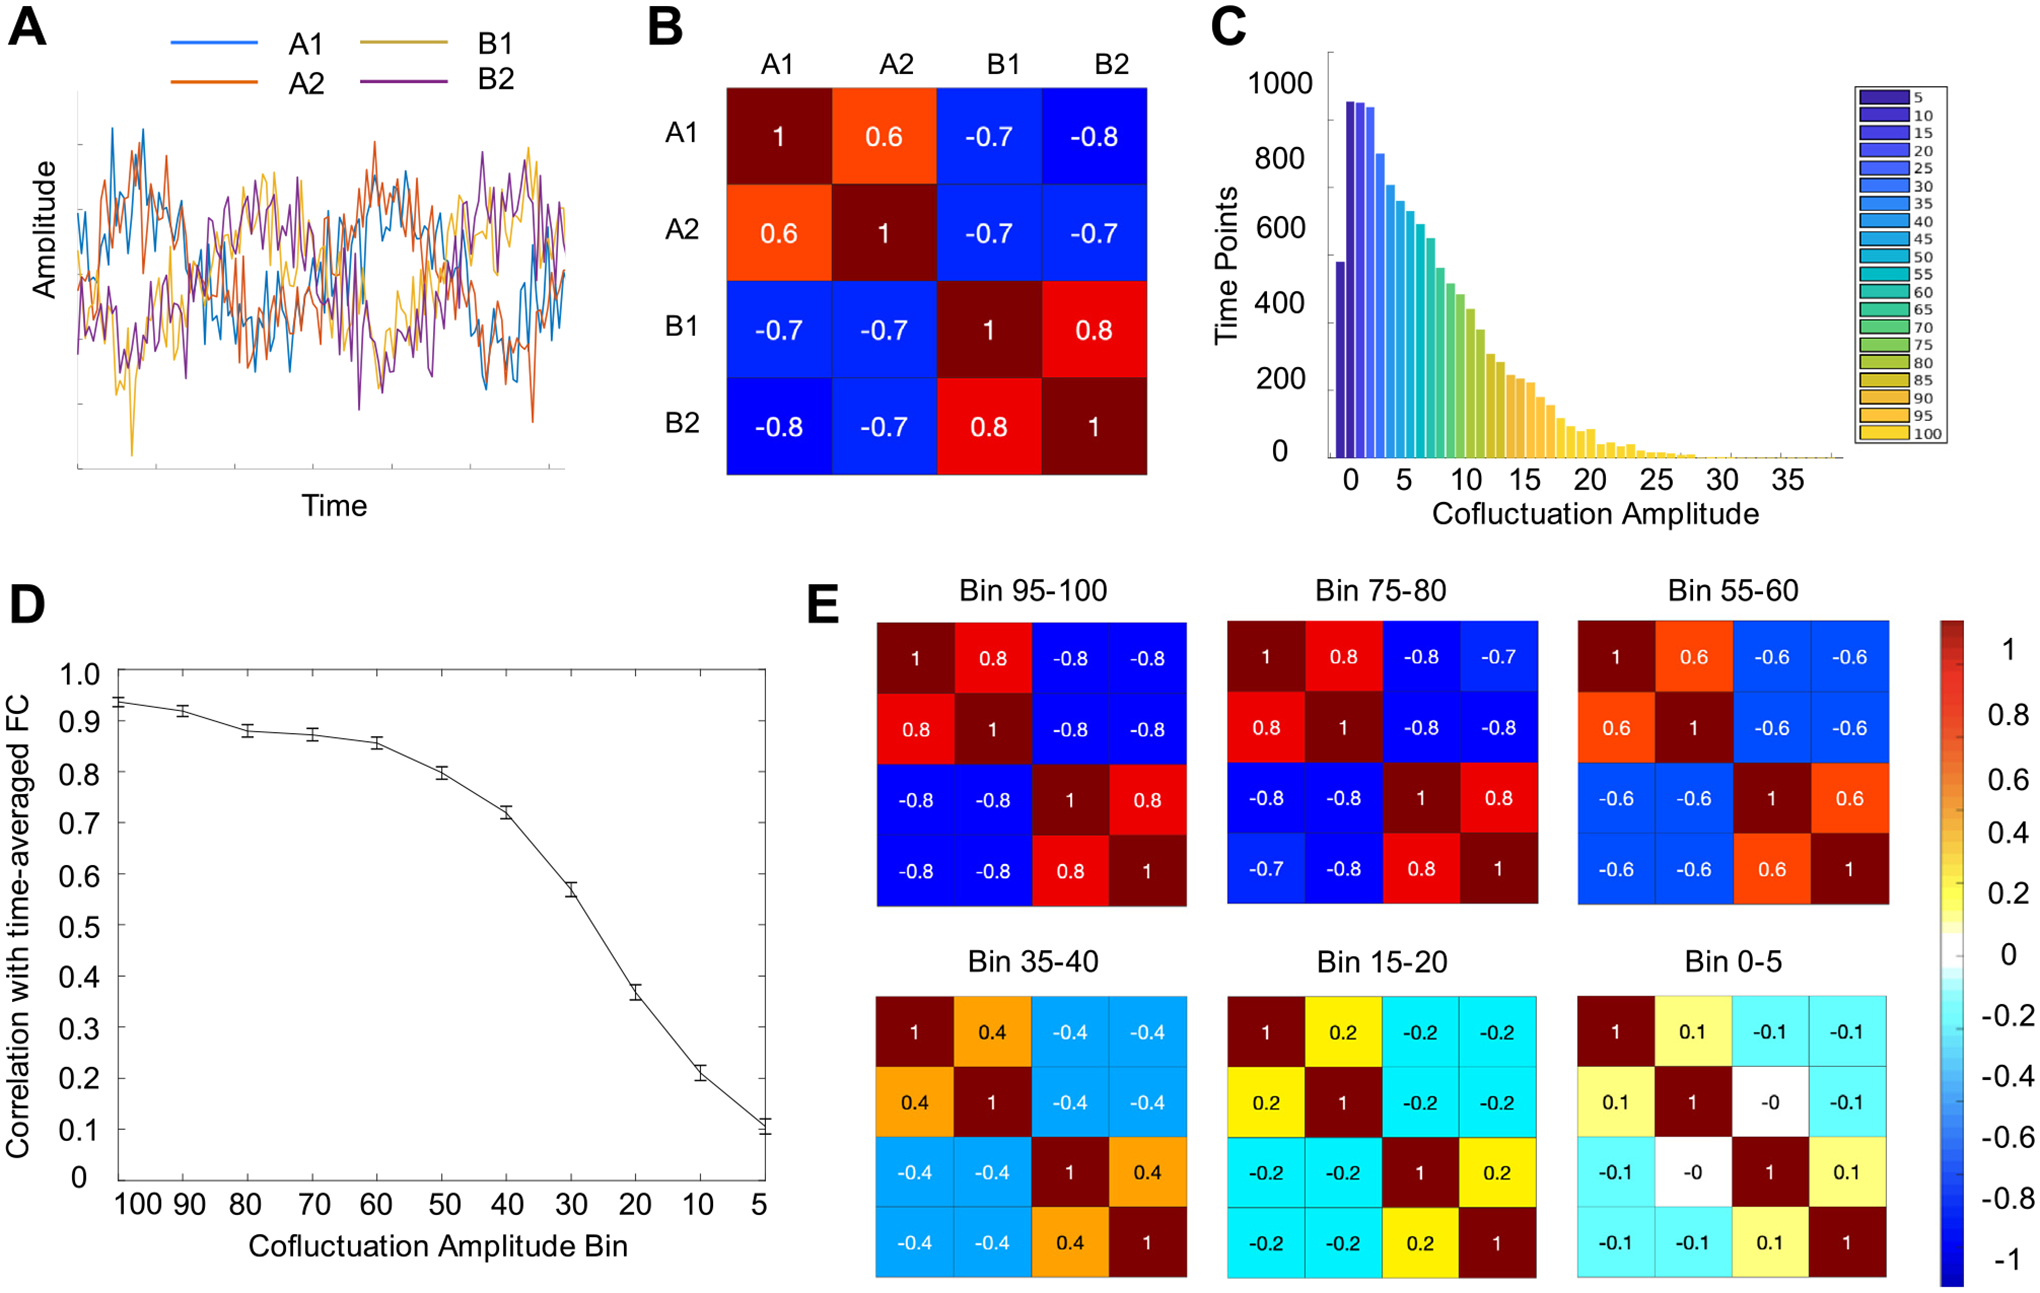
Fig. 3.

The relationship between network structure and cofluctuation is present in extremely simple non-BOLD-like models. We created a 2 network, 4 node model from sine waves and tested the relationship between network structure and cofluctuation. (A) Network A is made of two nodes, each with the sine(t) wave. Network B is made of two nodes, each with sine(t + π/2) wave. Random noise was added to all four nodes. (B) Over the time course, there is moderately high magnitude (r = 0.7) correlation between in-network nodes. (C) As in real data, there were points of high and low cofluctuation so it was possible to bin time points the same way as was done in real and BOLD-simulated data. (D) A similar relationship exists between cofluctuation and network structure where higher cofluctuation bins are better able to reproduce network structure from the overall time course. Error bars here represent SEM over 1000 iterations of the model. (E) This relationship is visually obvious in correlation matrices. In high cofluctuation bins, the two antagonistic networks are strongly present, and in low bins there is little or no relationship between nodes.
