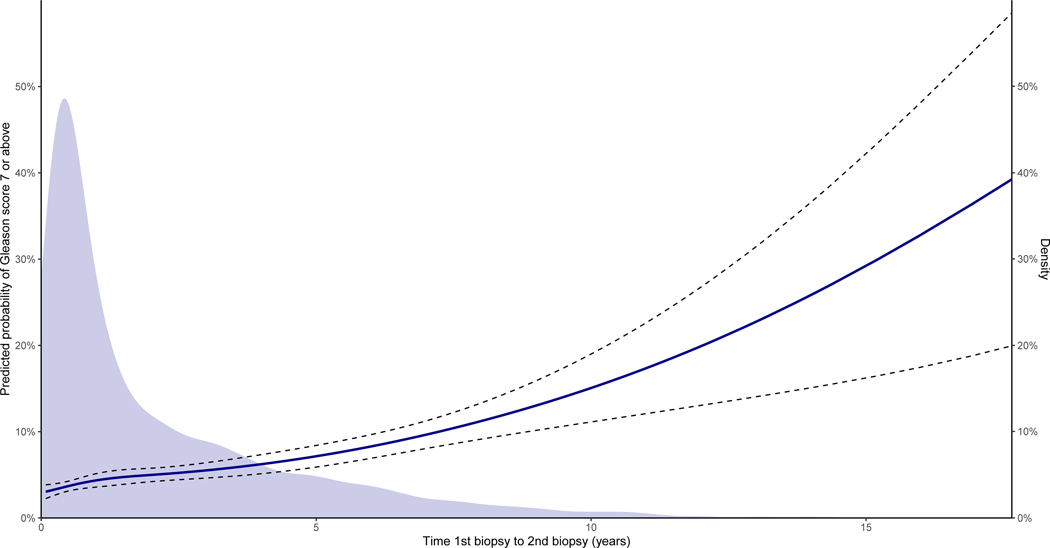
Figure 4:
Risk of Gleason score 7 or above prostate cancer in transrectal ultrasound-guided (TRUS) re-biopsy depending on the time between initial biopsy and first re-biopsy modelled for mean age, median prostate-specific antigen (PSA) and a normal digital rectal examination. at time of initial TRUS-biopsies. The 95% confidence interval is depicted with dotted lines (N=6,389). The density plot shows the distribution of time between initial biopsy and first re-biopsy. Note that there is a second y-axis on the right illustrating the scale of the density plot.

