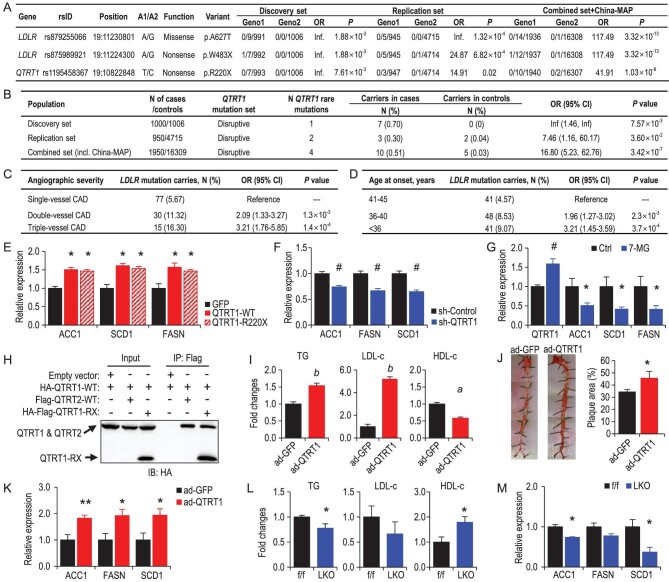
Figure 1.
Exome sequencing identifies rare mutations of LDLR and QTRT1 conferring risk for early-onset coronary artery disease. (A) Rare mutations in LDLR and QTRT1 were associated with EOCAD with a significance of P < 6.50 × 10⁻⁷ from two-sided Fisher's exact test. A1, minor allele; A2, major allele; Geno1, the genotype count for the homozygous minor/heterozygous/homozygous major alleles in EOCAD patients; Geno2, the genotype count for the homozygous minor/heterozygous/homozygous major alleles in controls. (B) QTRT1 gene enriched with rare mutations was associated with EOCAD from gene-wide association analysis with a significance of P < 2.97 × 10⁻⁶ from two-sided Fisher's exact test. (C) Associations between LDLR mutations and angiographic severity in EOCAD patients. OR, odds ratio; 95% CI, 95% confidence intervals. ORs were calculated from logistic regression models with adjustment of the top five principal components of ancestry. (D) Associations between LDLR mutations and age at onset in EOCAD patients. ORs were calculated from logistic regression models with adjustment of the top five principal components of ancestry. (E) Relative expression of genes related to de novo lipogenesis (DNL) in QTRT1-overexpressing HepG2 cells with overexpression of wild-type QTRT1 (QTRT1-WT) or mutated QTRT1 (QTRT1-R220X) or GFP control (GFP). (F) Relative expression of genes related to DNL in QTRT1-knock-down HepG2 cells (sh-QTRT1) and control HepG2 cells (sh-Control). (G) Relative expression of QTRT1 and genes related to DNL in QTRT1 inhibitor (7-methylguanine, 7-MG) treated HepG2. (H) The physical interaction between QTRT1 with QTRT2 and mutated QTRT1. (I) Levels of serum triglycerides (TG), LDL-c and HDL-c in ad-QTRT1 and ad-GFP mice; n = 6–9. (J) Representative images of Oil Red O-stained arteries in ad-QTRT1 and ad-GFP mice, and quantification of the percentage of plaque area in the Oil Red O-stained arteries; n = 6–9. (K) Relative hepatic expression of genes related to DNL in ad-QTRT1 and ad-GFP control mice; n = 6–9. (L) Levels of hepatic triglycerides (TG), LDL-c and HDL-c in liver-specific QTRT1 knockout mice (LKO) and control flox/flox littermates (f/f); n = 5. (M) Relative hepatic expression of genes related to DNL in liver-specific QTRT1 knockout mice (LKO) and control flox/flox littermates (f/f); n = 5. *P < 0.05; **P < 0.01; #P < 0.005; aP < 0.001; bP < 0.0005. Mann-Whitney test was used for the statistical analyses in Fig. 1E–M.

